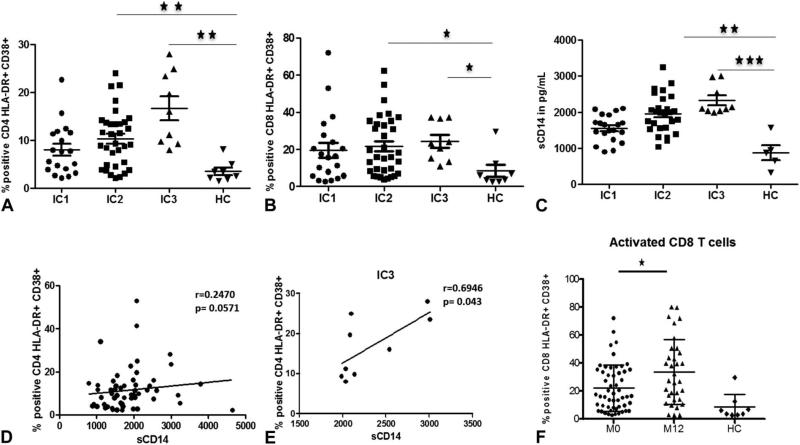
FIGURE 2.
HIV-infected children show generalized IA. CD4 T-cell (A), CD8 T-cell (B), and monocyte activation (C) in IC groups compared with healthy controls. Correlation of CD4 T-cell activation (D) and CD8 T-cell activation (E) with monocyte activation in total patients. CD8 T-cell activation at baseline (M0) and at 12 months follow-up (M12), compared with HC (F). Comparisons of median clinical values between different groups of subjects were performed by Mann–Whitney U test. Correlations between 2 variables were done using the Spearman correlation and linear regression. Asterisks indicate the levels of significance: *P < 0.05, **P < 0.01, ***P < 0.001.

