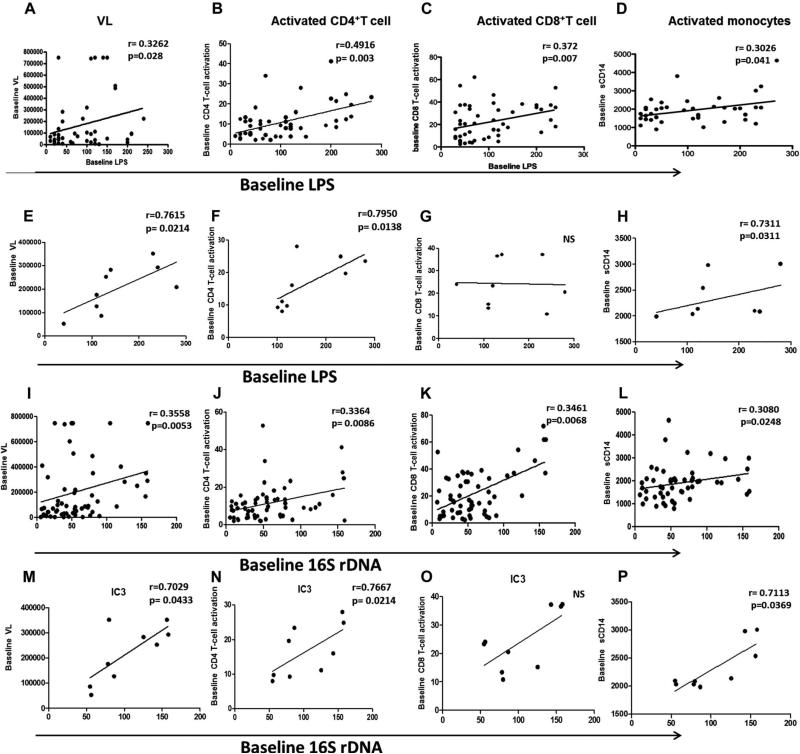
FIGURE 3.
Correlation of MT with IA. Correlation of baseline plasma LPS with VL (A), CD4 T-cell activation (B), CD8 T-cell activation (C), and monocyte activation (D) in total patients and IC groups (E–H). Correlation of baseline plasma 16S rDNA with VL (I), CD4 T-cell activation (J), CD8 T-cell activation (K), and monocyte activation (L) in total patients and IC groups (M–P). Correlations between 2 variables were done using the Spearman correlation and linear regression.

