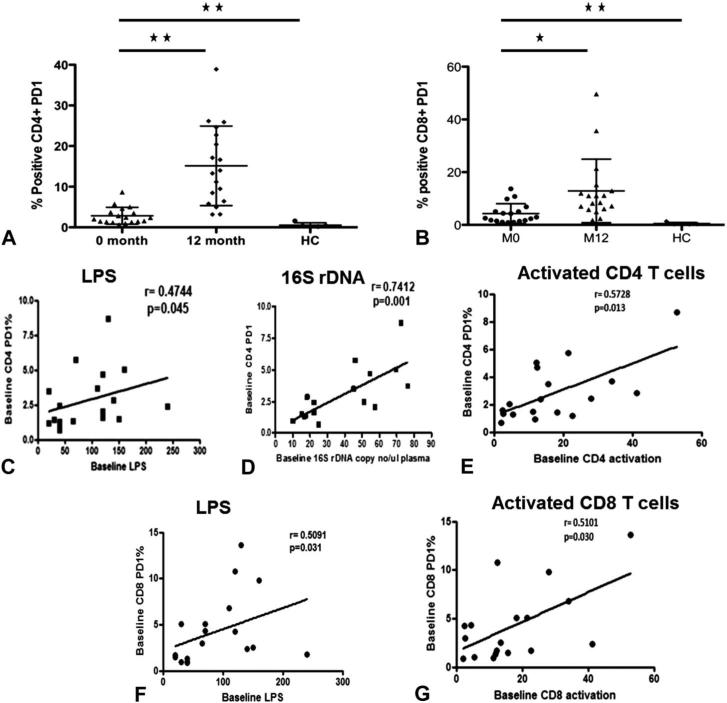
FIGURE 5.
Relationship of IE and IA and MT. Expression of PD-1 on CD4 (A) and CD8 T (B) cells at baseline compared with follow-up and healthy controls. Correlation between frequency of PD1-expressing CD4 T cells with LPS (C), 16S rDNA (D), and activated CD4 T cells (E). Correlation between frequency of PD1-expressing CD8 T cells and LPS (F) and activated CD8 T cells (G). Asterisks indicate the levels of significance: *P < 0.05, **P < 0.01, ***P < 0.001. Correlations between 2 variables were performed using the Spearman correlation and linear regression.

