
Figure 5.
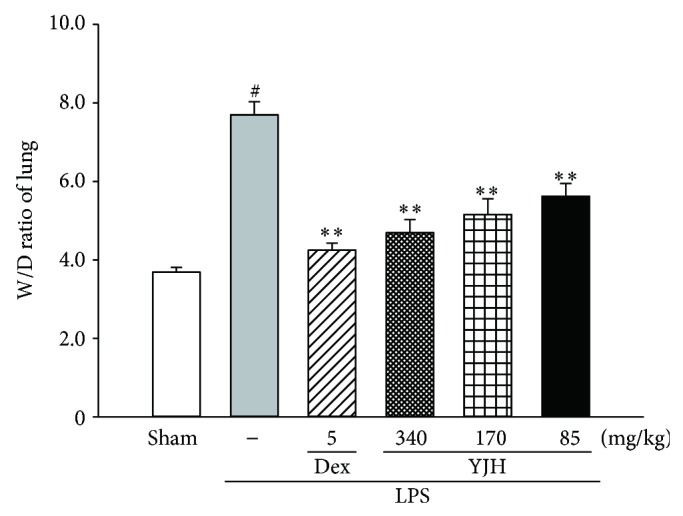
Effects of YJH on lung W/D ratio. Data was represented as the mean ± SEM (n = 10). # P < 0.01 compared to the sham group, * P < 0.05 and ** P < 0.01 compared to the LPS group.
Official websites use .gov
A
.gov website belongs to an official
government organization in the United States.
Secure .gov websites use HTTPS
A lock (
) or https:// means you've safely
connected to the .gov website. Share sensitive
information only on official, secure websites.
Effects of YJH on lung W/D ratio. Data was represented as the mean ± SEM (n = 10). # P < 0.01 compared to the sham group, * P < 0.05 and ** P < 0.01 compared to the LPS group.