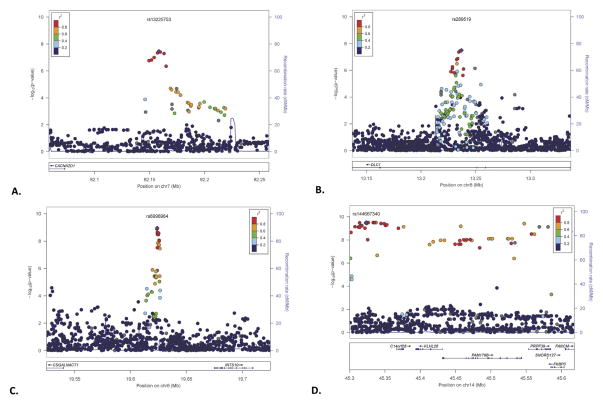
Figure 3.
Regional Manhattan plots. (A) Meta-analysis of the association results from single nucleotide polymorphisms (SNPs) in the 82.1 to 82.25 mega-base pair (MBP) region on chromosome 7 in Yale-UPenn + Study of Addiction: Genetics and Environment (SAGE) European American (EAs) with Fagerström Test for Nicotine Dependence (FTND) score adjusted for co-occurring substance dependence severity. The SNPs are color coded according to R2, with the most significant SNP (rs13225753) shown in purple. The light blue line and right y axis show the observed recombination rate in the HapMap CEU samples. (B) Meta-analysis of the association results from SNPs in the 13.15 to 13.3 MBP region on chromosome 8 in Yale-UPenn + SAGE African Americans (AAs) with FTND score. The SNPs are color coded according to R2, with the most significant SNP (rs289519) shown in purple. The light blue line and right y axis show the observed recombination rate in the HapMap Yoruba in Ibadan, Nigeria (YRI) samples. (C) Meta-analysis of the association results from SNPs in the 19.55 to 19.7 MBP region on chromosome 8 in Yale-UPenn + SAGE AAs with FTND score adjusted for co-dependent substance dependence severity. The SNPs are color coded according to R2, with the most significant SNP (rs6996964) shown in purple. The light blue line and right y axis show the observed recombination rate in the HapMap YRI samples. (D) Meta-analysis of the association results from SNPs in the 45.3 to 45.6 MBP region on chromosome 14 in Yale-UPenn + SAGE AAs with FTND score. The SNPs are color coded according to R2, with the most significant SNP (rs144667340) shown in purple. The light blue line and right y axis show the observed recombination rate in the HapMap YRI samples.

