Figure 4.
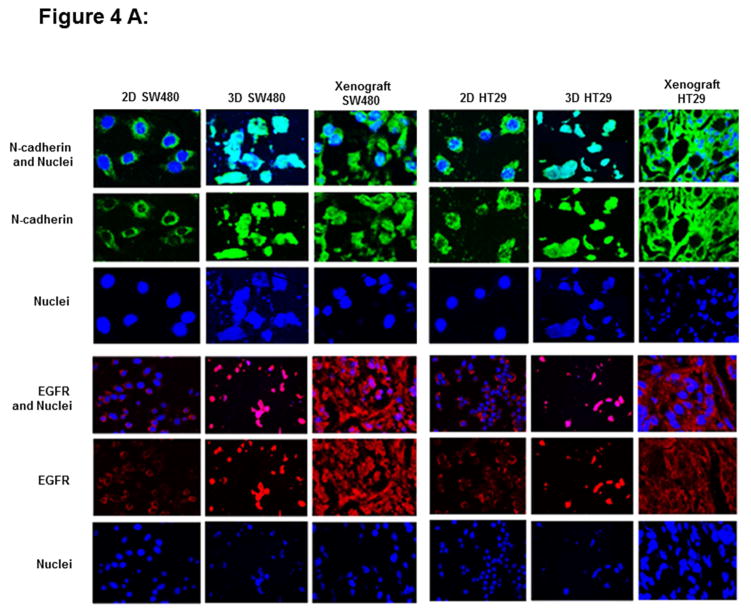
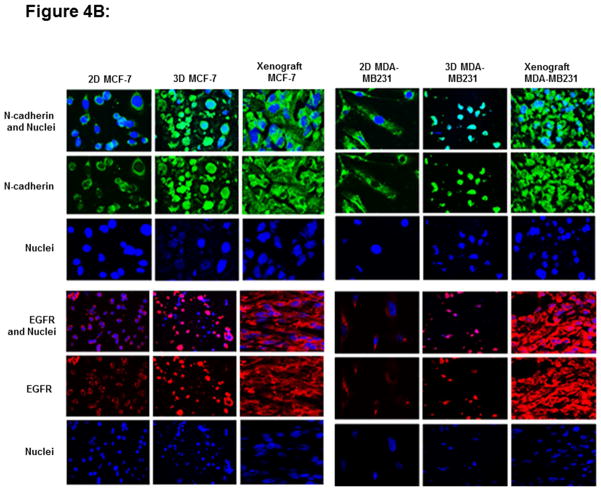
The expression of N-cadherin and EGFR markers in 2-D and 3-D cultures and xenografts of colon (HT29 and SW480) (Fig 4A) and breast cancer cells (MCF-7, MDA-MB231) (Fig 4B). Two dimensional cultures show expression of N-cadherin (green fluorescence) in the cytoplasm and nucleus. In contrast, levitated 3-D cells and matching xenografts shows large N-cadherin activity upon cellular aggregation and demonstrates expression of N-cadherin in the cytoplasm, nucleus, cell membrane or cell-cell junctions. EGFR (red fluorescence) is predominantly punctate and intracellular in 2D cultures and it is found in high expression in membrane and at points of cell-cell contact in 3D cells or xenografts. These figures were subjectively quantified based on color intensity.


