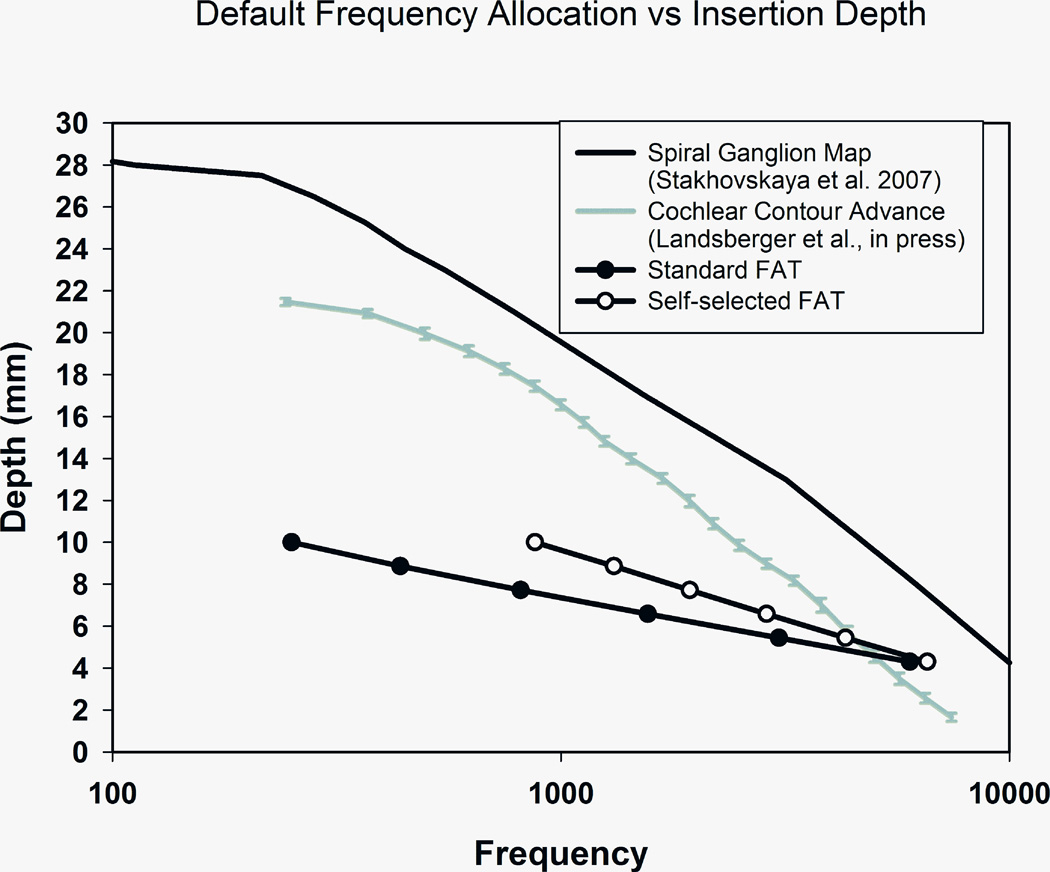
FIGURE 9.
Cochlear distance vs. frequency curves for stimulation of the human spiral ganglion (black curve), the average location of Contour Advance electrodes using the standard FAT (gray curve), and the location of subject 2’s electrodes in the short—insertion ear using the standard FAT (black circles) and the self—selected FAT (white circles).

