
Figure 1. atRA promotes keratinocyte proliferation.
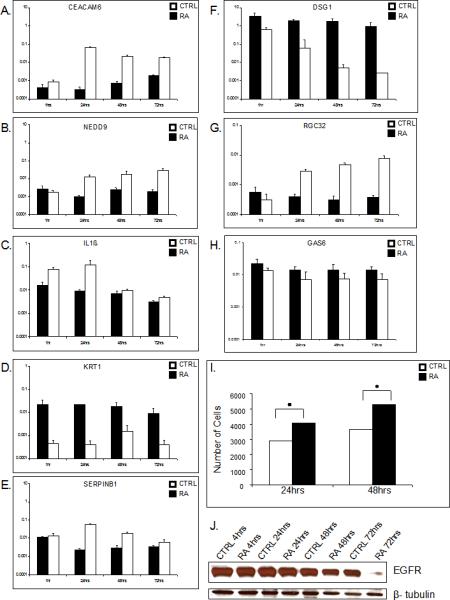
A bar graph showing the compatible regulation of cell-cycle related genes among other, obtained by using quantitative real time PCR. Mean values of expression levels were represented after normalization to expression level of EEF1A1 (A-H). Bar graph shows number of cells of triplicate experiments utilizing proliferation assay. A statistically significant increase in number of keratinocytes was found after 24 (p= 0.001) and 48 h (p=0.049) of atRA treatment when compared to untreated cells (I). Western blot analyzes confirms down regulation of EGFR (G).