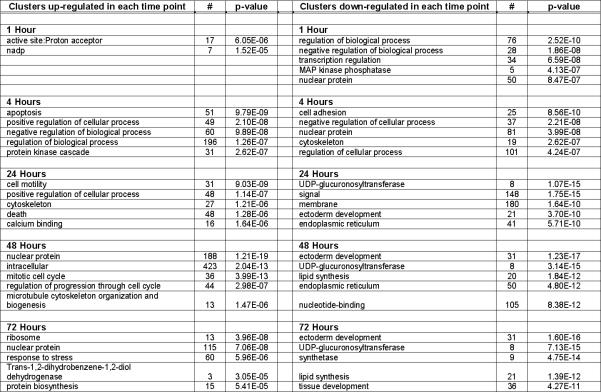
Figure 2. Functional annotation clusters.
Five clusters, if any, with the most significant p-value for each time point are listed. For a complete list of all the clusters with a p-value less than 10−4, see supplemental Table 2. #, the number of genes in each category.

