
Figure 5. Transcription factors whose binding sites are over-represented in the RA-regulated genes.
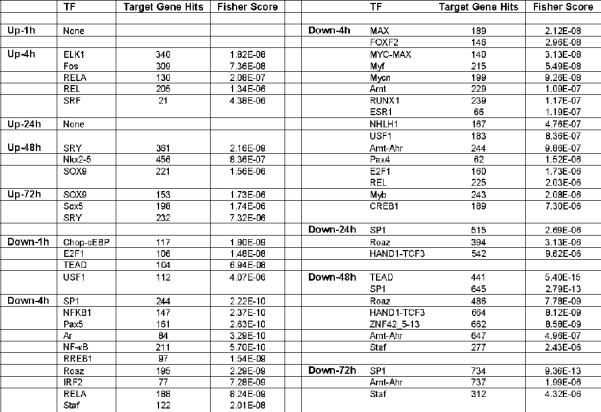
TF, names of transcription factor; target gene hits, the number of genes induced (up) or suppressed (down) at that time point showing the given transcription factor binding site; Fisher score, p-value in the one-tailed Fisher exact probability analysis. Those with a p-value less than 10−5 are listed in this table.