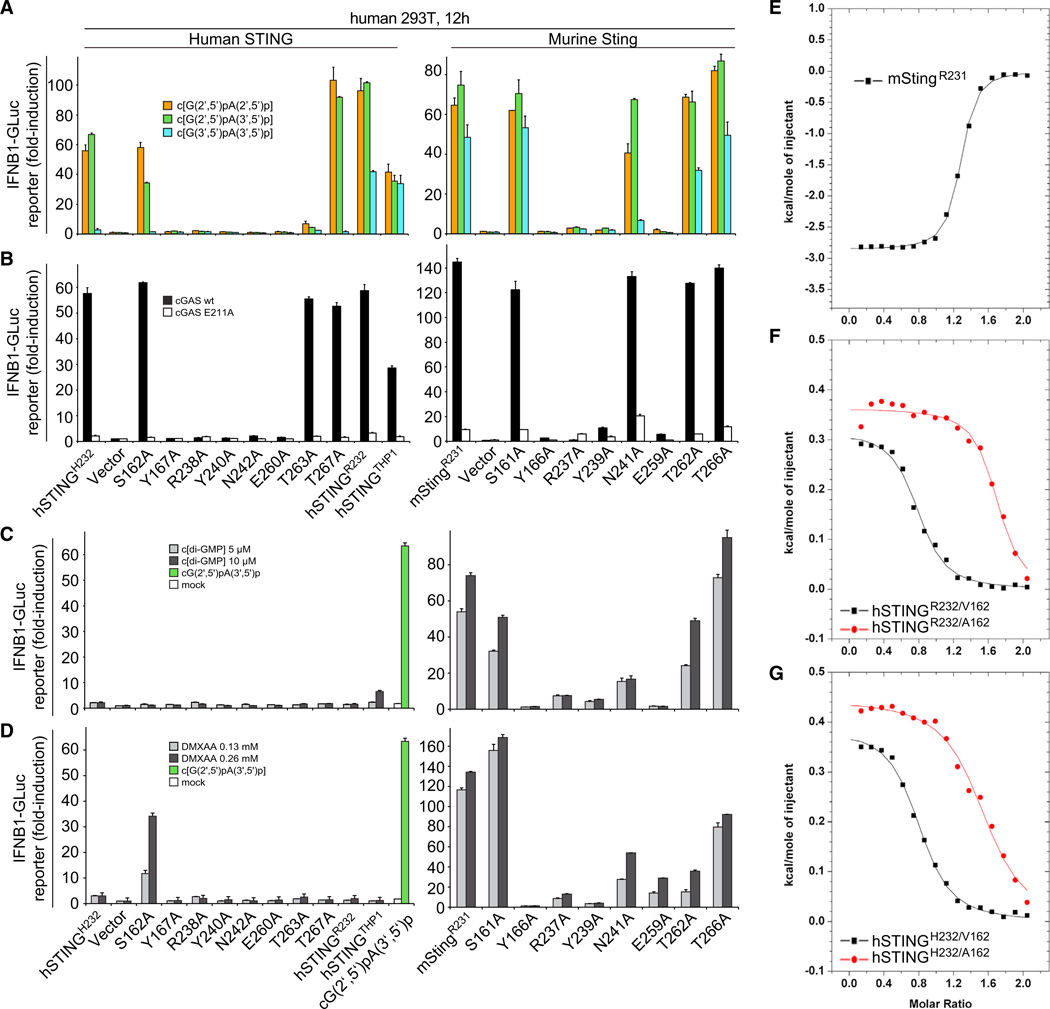
Figure 7. Mouse and Human STING Mutational Analysis.
(A) HEK293T cells were transfected with reporter constructs and human or murine STING expression plasmids as indicated. After 12 hr, cells were digitonin permeabilized to deliver cGAMP linkage isomers (5 µM concentration, 30 min permeabilization) and incubated for an additional 12 hr, followed by luciferase-reporter assay.
(B) To gauge STING mutant stimulation by murine cGAS compared to the inactive cGAS mutant E211A, plasmids containing the indicated human or murine STING variants were cotransfected with either cGAS form and luciferase reporter constructs. Luciferase induction was determined after 30 hr. In this setting, the transfected plasmids provide the dsDNA stimulus for cGAS activation. Activation is expressed as fold induction in relation to control plasmid pMAX-GFP.
(C) HEK293T cells were transfected as in (A) and stimulated with c[di-GMP](5 and 10 µM) following digitonin permeabilization. Luciferase activity was determined 12 hr after stimulation. As negative and positive controls, HEK293T cells transfected with hSTINGH232 were mock-treated (white bar) or stimulated with 5 µM c[G(2′,5′)pA(3′ ,5′)p] following digitonin permeabilization (green bar), respectively.
(D) HEK293T cells were transfected as in (C) and after 12 hr stimulated with medium containing DMXAA (136 and 266 µM). Luciferase activity was measured after additional 12 hr.
(E) ITC binding curves for complex formation between DMXAA and mStingR231.
(F) ITC binding curves for complex formation between DMXAA and hSTINGR232/A162 and hSTINGR232/V162.
(G) ITC binding curves for complex formation between DMXAA and hSTINGH232/A162 and hSTINGH232/V162.
Data points in (A to D) were determined in triplicate and are depicted as the mean ± SEM. We have no explanation at this time for high-stoichiometry N values (∼1.5, instead of the expected 1) for the binding curves for A162 mutants of both hSTINGH232 and hSTINGR232 (F and G).
Related to Figures S6 and S7, and Table S6.

