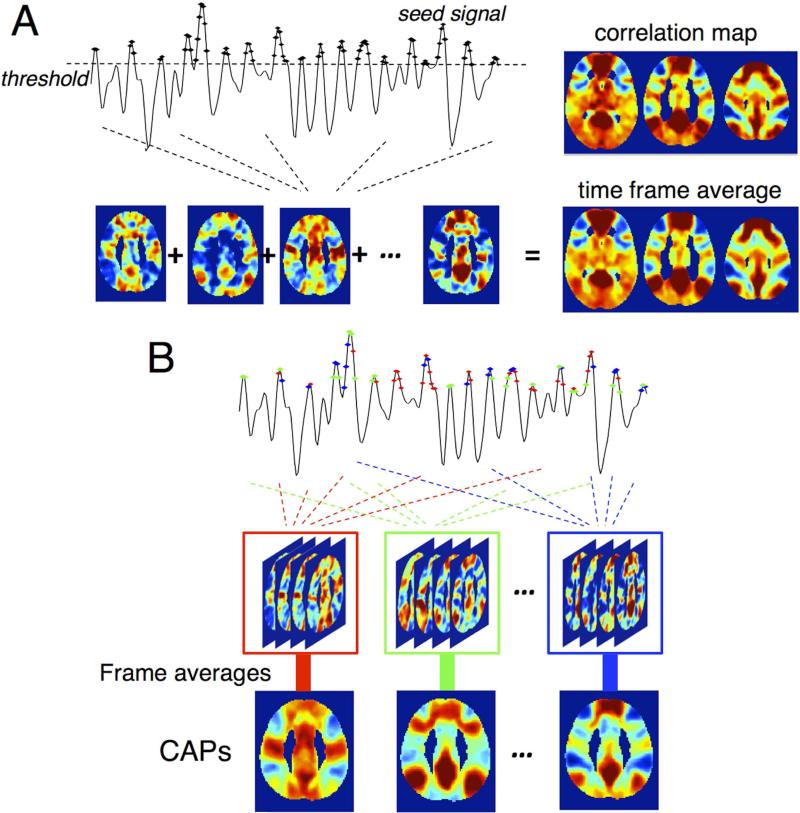
Fig. 1.
Illustration of CAP analysis in (Liu and Duyn, 2013) with the resting state datasets in this study (see section 2.2 Experiments and Analysis). (A) Conventional seed-based correlation map can be replicated by averaging time frames when the seed signal exhibits relatively large BOLD contrasts; (B) The scheme to generate CAPs. Different colors indicate different CAPs in temporal clustering.

