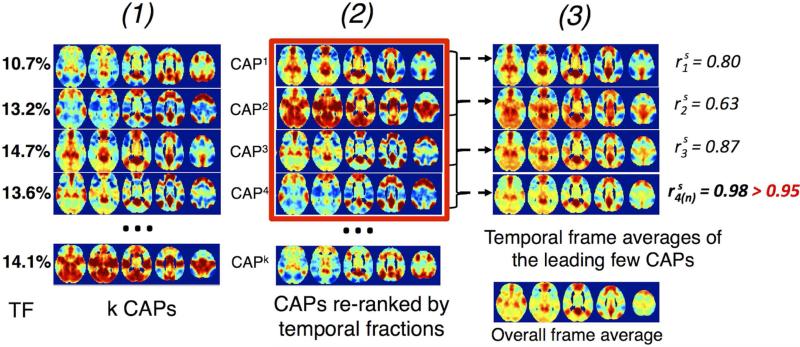
Fig. 2.
Steps to extract the dominant CAP-set for each cluster number k. (1) extract k CAPs, and their temporal occurrence fractions, ‘TF’; (2) reorder the k CAPs in descending TF as CAP1, CAP2, ... CAPk; (3) compute , spatial similarity of the weighted (by TF) average of the top-ranked CAPs with the overall frame average. Top-ranked CAPs {CAPj}1≤j≤n with & (in red rectangle) comprise the dominant CAP-set at k.

