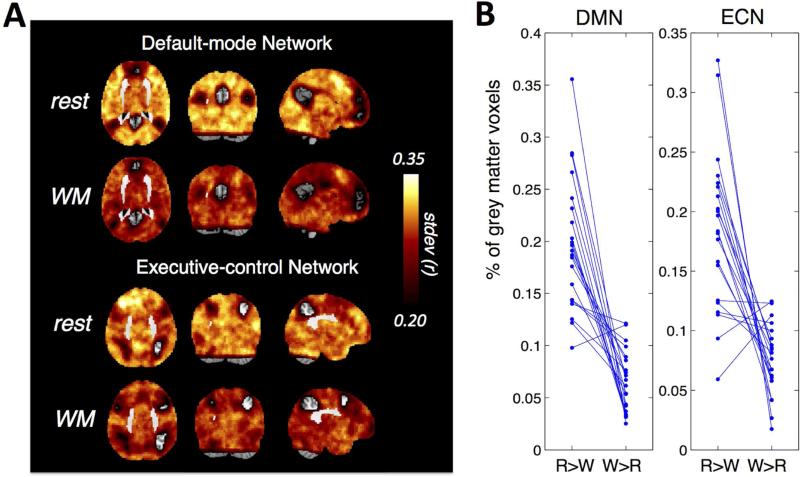
Fig. 4.
(A) Variability (standard deviations) over the sequence of 1-min sliding-window correlations between each brain voxel and the DMN and ECN seeds, averaged across 21 subjects; (B) Spatial extent of grey matter voxels with higher linear correlation variations during rest compared to WM task vs. the other way around for each subject (the difference of variability is thresholded at 0.1). ‘R’ stands for ‘rest’, ‘W’ stands for ‘WM task’. Each blue straight line connects the percentage values (‘R>W’ and ‘W>R’) of a single subject.

