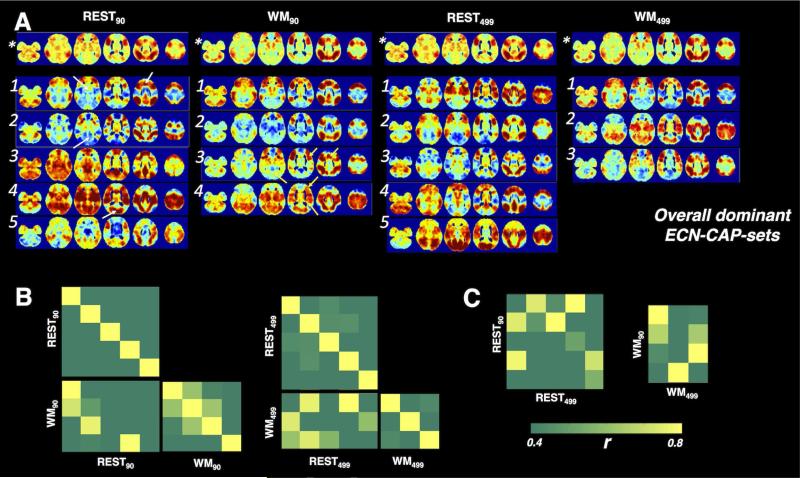
Fig. 6.
(A) The spatial profiles of the dominant CAP-sets associated with ECN. Numbers identify CAPs in each set, (*) denotes the overall frame average. (B) The spatial similarity covariance matrices between the overall dominant REST-CAP-set and WM-CAP-set for ECN, and within each dominant CAP-set. (C) The spatial similarity between the “overall dominant CAP-sets” derived with ROI90 and ROI499w.

