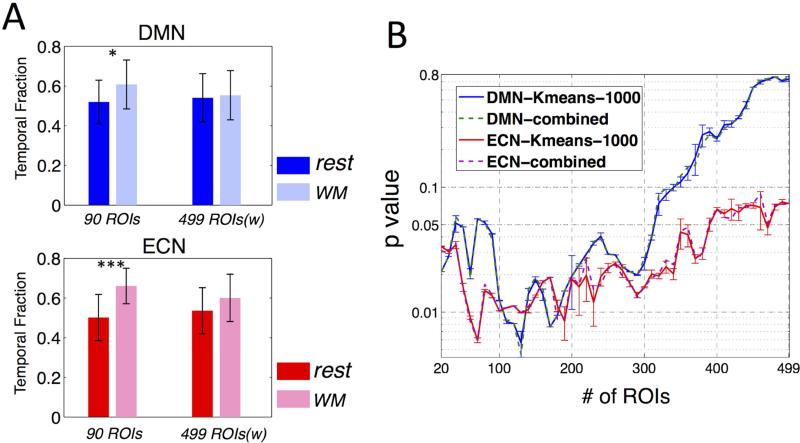
Fig. 8.
(A) Temporal fractions of the 1st dominant CAPs during sustained WM task compared to rest (p<0.05 *, p<0.00005 ***); (B) P values (group paired t-test, the temporal fraction of the 1st dominant CAP during WM task compared to rest) as a function of number of ROIs (in descending order of importance in differentiating two CAPs, see text 3.2.2 Temporal fractions of the 1st dominant CAP) included in the initial K-means clustering, where ‘-1000’ indicates the mean and standard deviation of t values associated with the 1000 K-means clustering results, and ‘combined’ indicates the t value of the synthesized clustering result from the 1000 K-means trials (see text 2.2.7 CAP analysis).

