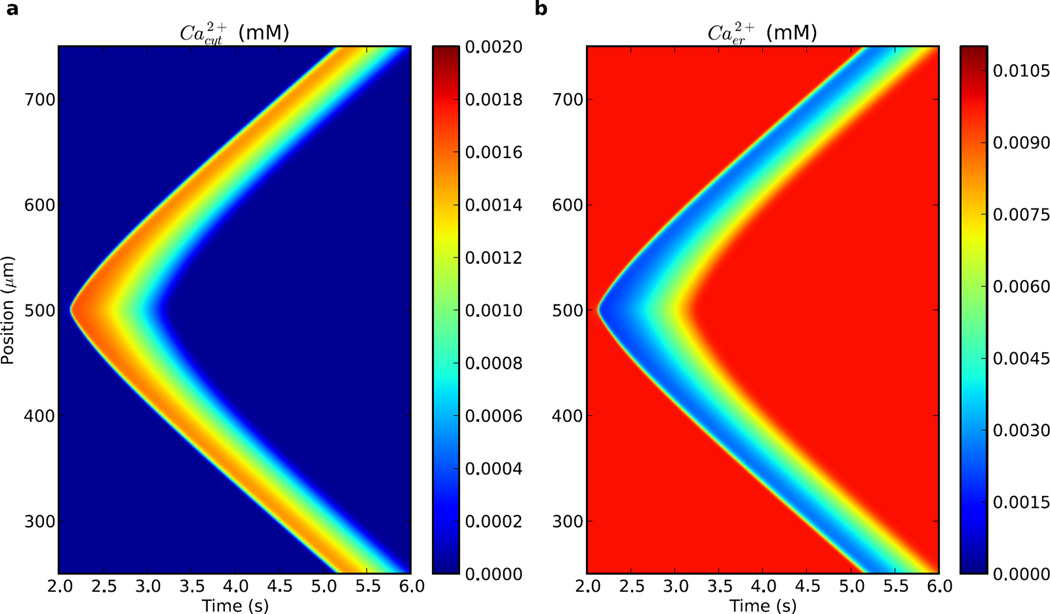
Figure 2.
Ca2+ wave propagation with baseline parameters. Elevated IP3 stimulus placed at mid-dendrite (500 µm on y-axis) after 2 s past start of simulation. (a) cytosolic [Ca2+] shows a wave of increased concentration (b) ER [Ca2+] shows a mirror image wave of decreased concentration as Ca2+ is released to cytosol.

