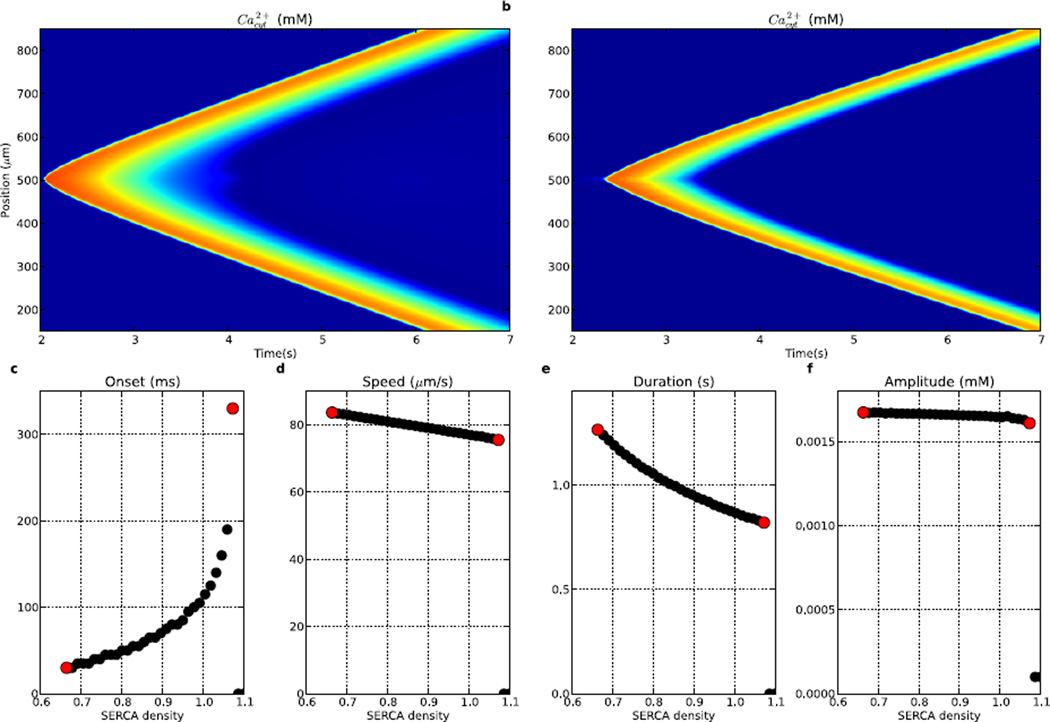
Figure 4.
Ca2+ wave propagation is sensitive to the density of SERCA. Tested by varying SERCA density relative to baseline (n = 45). (a) hyper-excitable Ca2+ wave produced with 0.66× baseline SERCA, (b) diminished Ca2+ wave produced with 1.03× baseline SERCA, (c) time to Ca2+ wave onset (0 indicates no wave at the SERCA level), (d) speed, (e) duration (median duration of Ca2+ elevation across dendritic locations), (f) peak amplitude. Left (right) red dots in c–f corresponds to activity shown in (a) ((b)). (Colorscale in (a) and (b) same as in Fig. 2.)

