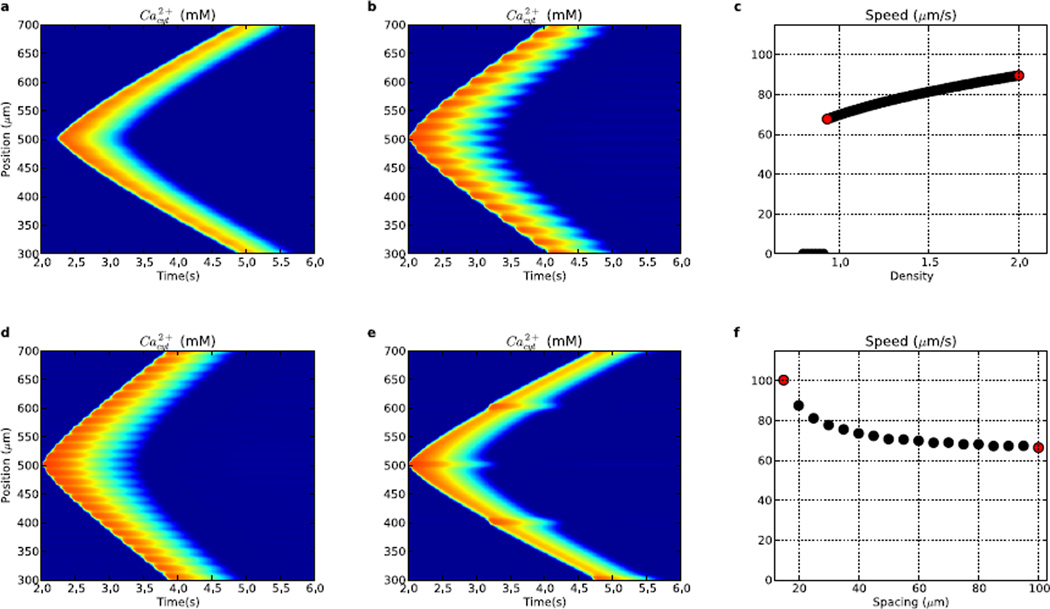
Figure 7.
Comparison of waves (and wave speeds) generated from varying IP3R hotspot density (a–c) and separation (d–f). (a) 20 µm spacing; 0.93× density. (b) 20 µm spacing; 2× density. (c) wave speed as a function of IP3R hotspot density, (d) 15 µm spacing; 1.87× density. (e) 100 µm spacing; 1.87× density. (f) wave speed as a function of IP3R hotspot spacing. (Colorscale in a,b,d,e same as in Fig. 2.) Red points in (c) ((f)) are from waves in (a),(b) ((d),(e)).

