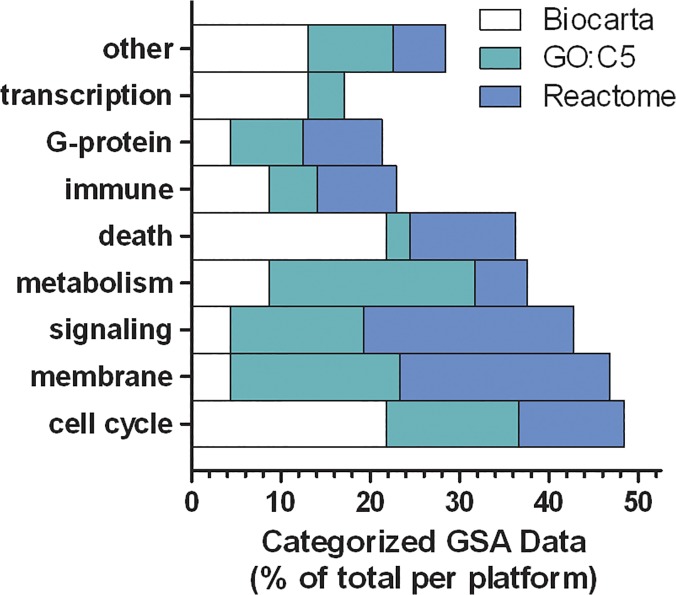
Fig 3. Categorized Gene Set Enrichment Analysis (GSEA) data to contrast the effects of morphine detected using three separate gene set collections.
Individual GSEA data points from Tables 2–6 were assigned to basic biological function categories and the counts for each category were divided by the total for each gene set collection (Reactome, dark gray; GO:C5, light gray; Biocarta, white). This illustrates the relative agreement between gene set collections used to detect differential gene expression after neonatal morphine treatment.

