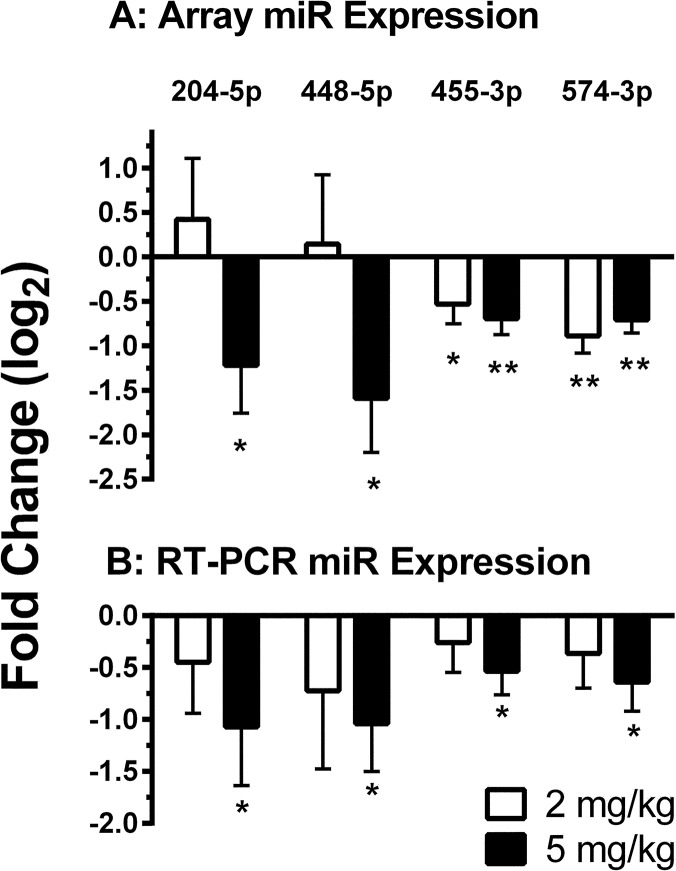
Fig 4. Hippocampal miR expression in stressed neonatal mice was down-regulated by morphine treatment.
Data are mean (+SEM) microarray expression (panel A) and RT-PCR expression (panel B) values presented as fold-change (log2) compared to untreated control mice. Values from mice receiving either 2 mg/kg morphine (unfilled bars) or 5 mg/kg morphine (filled bars) are shown. Expression values that differ significantly from control (0) are indicated as * or ** = P ≤ 0.05 or 0.01, respectively.

