
Figure 1.
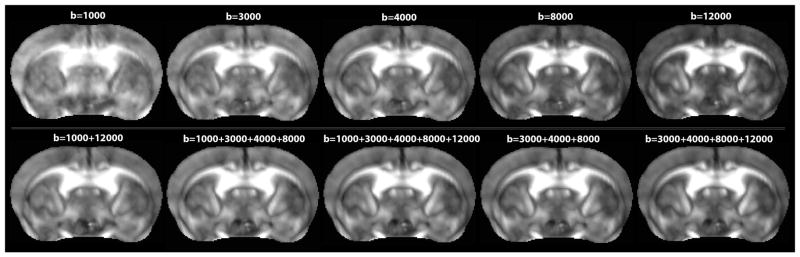
Quantitative fractional anisotropy (QA) maps computed for single- and multi-shell DWI acquisitions in the mouse brain. The contrast to noise ratio visibly increases with the b-value shell, while the highest signal to noise ratio (SNR) is found in the lowest b-values shells (especially at b-value=1000 s/mm2).