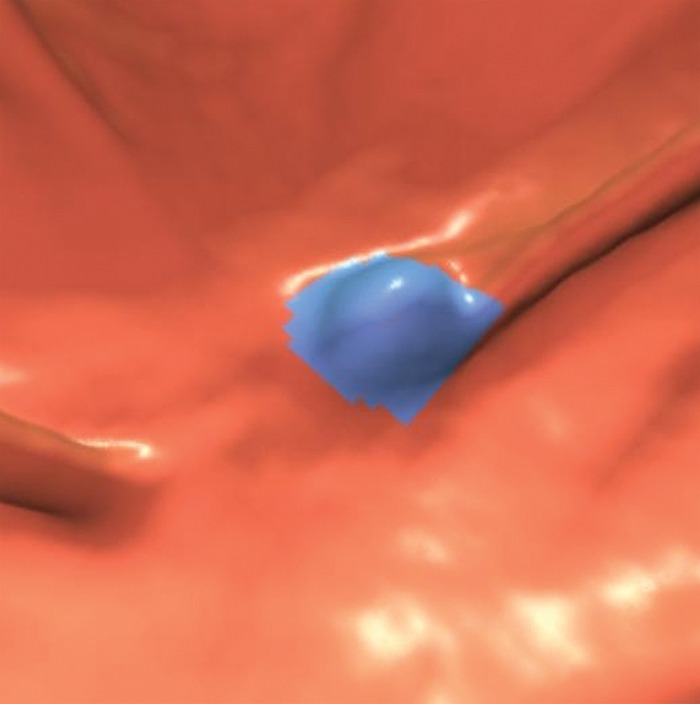
Figure 10a.

Stool. (a, b) Endoluminal 3D (a) and magnified axial 2D (b) CT colonography images show a CAD polyp candidate (blue area in a and arrow in b). (c) Endoluminal 3D CT colonography image with an overlying attenuation-dependent color map generated with a translucency rendering tool shows the internal architecture of the polyp candidate. The color map confirms internal contrast tagging of the polyp candidate, a finding characteristic of stool. Five and seven readers reported this finding as a polyp during the CAD-unassisted and CAD-assisted sessions, respectively.
