
Figure 10c.
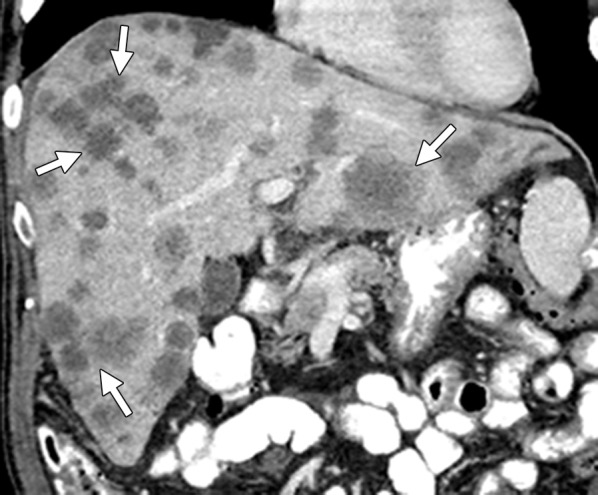
Treatment response in a 58-year-old man with mCRC to the liver. (a) Coronal reformatted contrast-enhanced baseline CT image demonstrates multiple heterogeneous liver metastases with an irregular tumor-liver interface (arrows). (b) On a follow-up CT image obtained after three cycles of treatment with FOLFIRI and bevacizumab, the lesions (arrows) demonstrate a slight increase in size, a concurrent decrease in attenuation, relative homogeneity, and a sharp tumor-liver interface. The size increase can be confused with disease progression (pseudoprogression). However, the other morphologic changes, taken together with a decrease in the tumor markers, favor true treatment response. (c) Follow-up CT image obtained 2 months later shows a decrease in the size of the lesions (arrows), a finding that indicates continued treatment response.