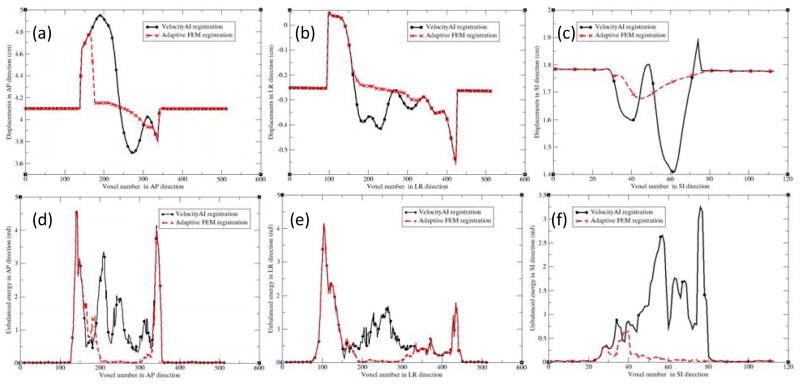
Figure 5.
The profiles along the demarcated lines (Fig 4a) for patient 2 in the directions: (a) AP, (b) LR, and (c) SI; AP, LR and SI represent the anterior-posterior, left-right, and superior-inferior directions, respectively. (d–f) are the corresponding unbalanced energy (UE) values for Fig 4(a–c).

