
Figure 4.
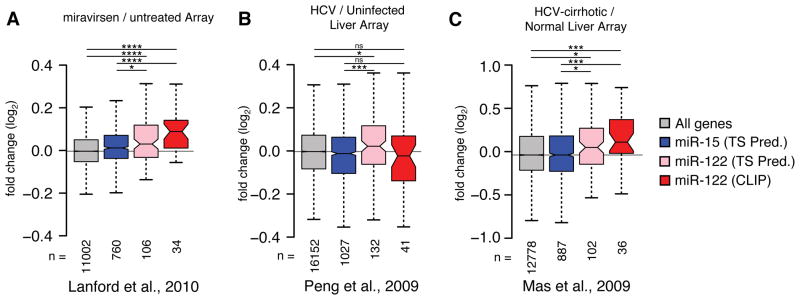
Meta-analysis of published array data suggests HCV induced changes on the miR-122 target network. (A) Miravirsen pre- and post-treatment array data from four HCV infected chimpanzees (Lanford et al., 2010) was binned according to conserved 7–8mer TargetScan (TS) predictions for miR-15 or miR-122, or from miR-122 targets with CLIP support from the current study. Boxplot whiskers denote 1.5 times the inter-quartile distance from the nearest quartile. The mean fold change in expression for miR-122 targets was compared to miR-15 targets or all genes represented on the array, where the number of genes in each bin (n) is indicated. (B) Analysis as in (A) comparing 24 HCV positive to 5 negative liver biopsies (Peng et al., 2009). (C) Analysis as in (A) comparing 41 HCV positive with cirrhosis samples to 19 normal livers (Mas et al., 2009). Asterisks: ****P<0.0001, ***P<0.001, ** P<0.01, *P<0.05, ns P>0.05, two-sided Mann-Whitney U-test.