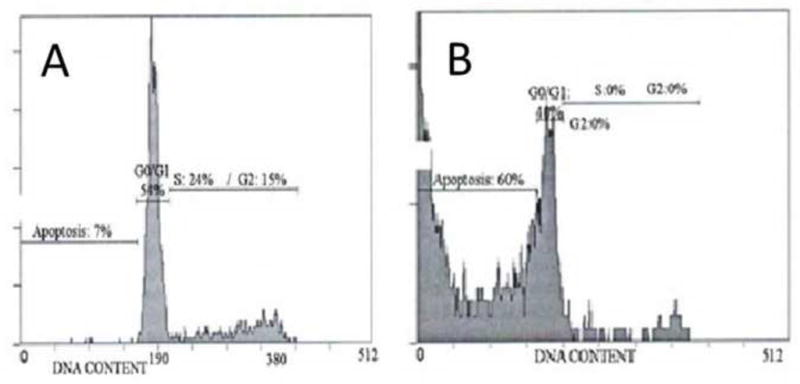
Fig. 4.

Representative histograms of cell cycle analysis by PI after 72 hours treatment with 0 and 1 μM Crizotinib, performed in triplicate. (A) The untreated cell suspension showed minimum of apoptosis with 7% of the population in sub-G0/G1. (B) Crizotinib treated cells show marked apoptosis by observation of significant increase in sub-G0/G1 population (60%).
