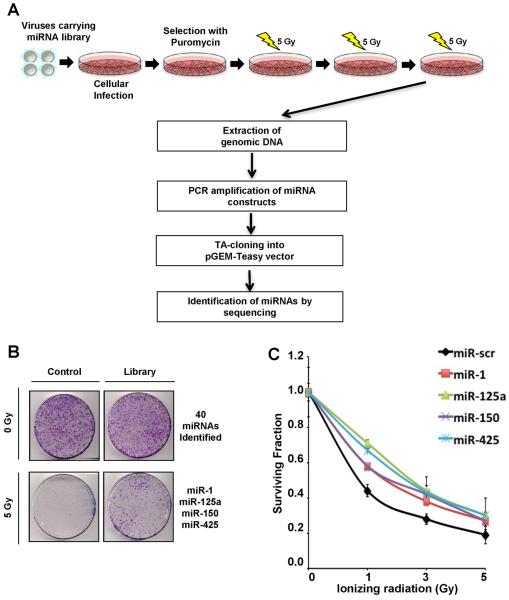
Figure 1. miRNA screen for radioresistance.
(A) Schematic of radioresistant screen. U2OS cells were infected with retroviruses carrying the miRNA library(13). Cells expressing miRNAs were selected with puromycin and subjected to the fractionated doses of 5 Gy γ-irradiation (IR) over 5 days. After a round of IR exposure, 30 best-growing colonies were selected and pooled together before undergoing continuous rounds of IR. After 3 rounds of collecting radioresistant clones, genomic DNA was purified and amplified to clone into pGEM-T Easy vector and to identify the over-expressing miRNAs by sequencing. (B) Representative image of clonogenic survival assay. U2OS cells carrying control or the miRNA library were stained for colony quantification after 3 rounds of the fractionated doses of IR. Forty miRNAs that exhibited a growth advantage independent of radiation were excluded from selection and 4 miRNAs, miR-1, miR-125a, miR-150 and miR-425 that were selectively enriched in irradiated cells were chosen for further studies. (C) Clonogenic survival assay to validate the impact of selected miRNAs on radioresistance. U2OS cells were transfected with indicated miRNA mimics and subjected to indicated doses of IR before colony quantification. Curves were generated with Mean ± S.D. of 3 independent experiments. Significant differences were confirmed between the negative controls and the four experimental lines at all doses of radiation and in the area under the curve (AUC) comparison (ANOVA (p < 0.05) and Tukey's post hoc (p < 0.05) test).

