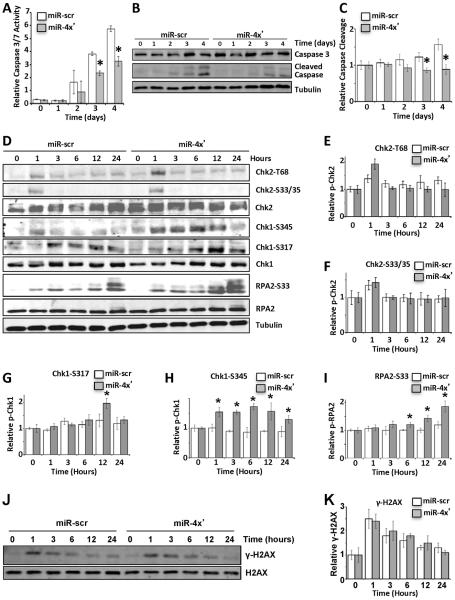
Figure 4. Impact of miRNAs on DNA damage reponse.
LN229 cells stably expressing scramble (scr) or miR-1, miR125a, miR-150 and miR-425 (miR-4X') were exposed to 10 Gy IR. (A–C) Impact of miRNAs on apoptosis. Induction of caspase3/7 enzymatic activities was measured using the Caspase Glo kit at indicated days after IR (A). Cleavage of caspase 3 was monitored by immunoblotting (B), which was quantified by Image J (C). (D–I) Impact of miRNAs on checkpoint response. Levels of total and phosphorylated Chk2, Chk1 and RPA2 were detected at indicated time points after IR via immunobot with tubulin as a loading control (D). Quantification with normalization of phospho-form to total protein was graphically demonstrated for Chk2 pT68 (E), Chk2 S33/35 (F), Chk1 S317 (G), Chk1 S345 (H), and RPA2 S33 (I). (J–K) The kinetics of H2AX phosphorylation was demonstrated at indicated time points after IR via immunoblot (J) and phospho-form relative to total H2AX was quantified (K). In all panel but B, D and J the mean ± S.D. of 3 independent experiments is demonstrated. Comparison was done with one-way ANOVA (p < 0.05) and * represents p < 0.05 calculated with Tukey's post hoc test.

