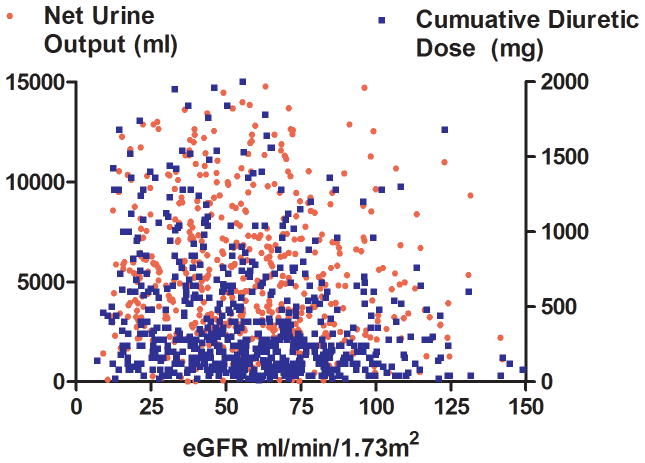
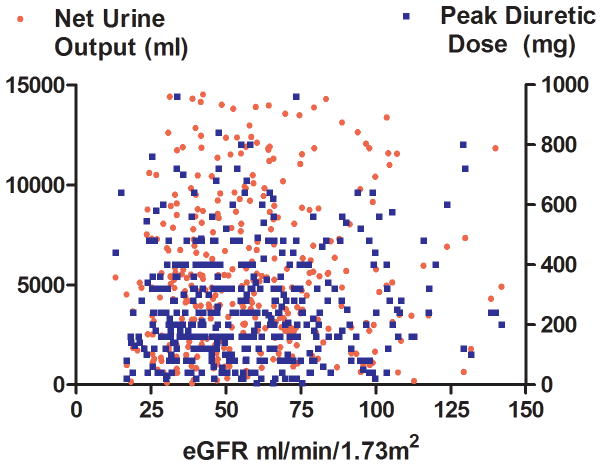
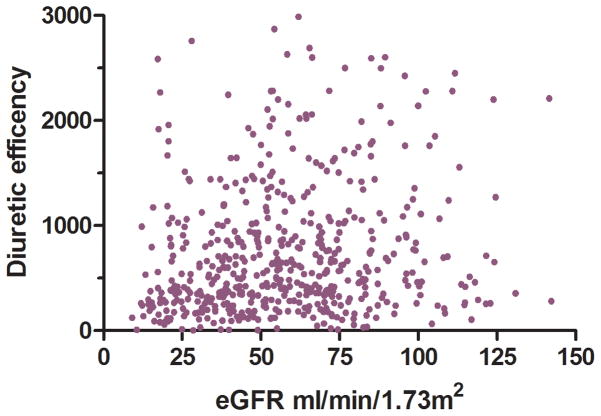
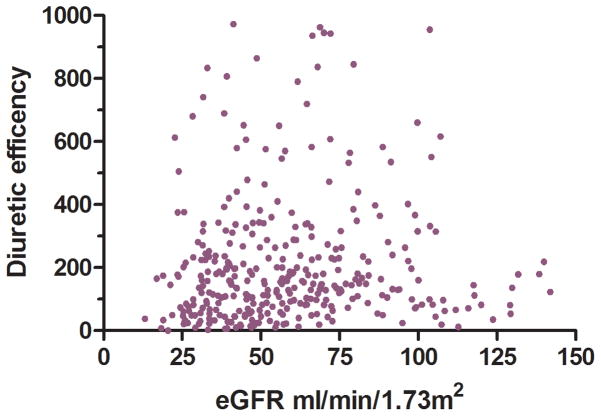
Figure 2.
Scatterplots of eGFR and net fluid output, diuretic dose (Panel A) and diuretic efficiency (Panel B) in the Penn Cohort (top panels) and ESCAPE cohort (bottom panels) eGFR: Estimated glomerular filtration rate. Diuretic efficiency expressed as mL of net fluid output per 40 mg of furosemide equivalent.


