
Figure 1.
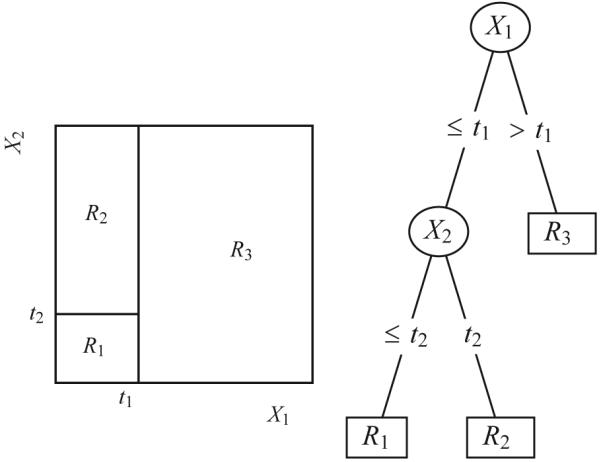
Decision trees describe partitions of the covariate space that maximize differences in the outcome. Right: A decision tree describing partitions of the covariates X1 and X2 into the areas R1, R2, and R3. In this example, covariate X1 was split at value t1, and a subsequent split of covariate X2 at value t2 was found in the left subtree. Left: A two-dimensional plot of the partitioned covariate space in the areas R 1, R 2, and R3.