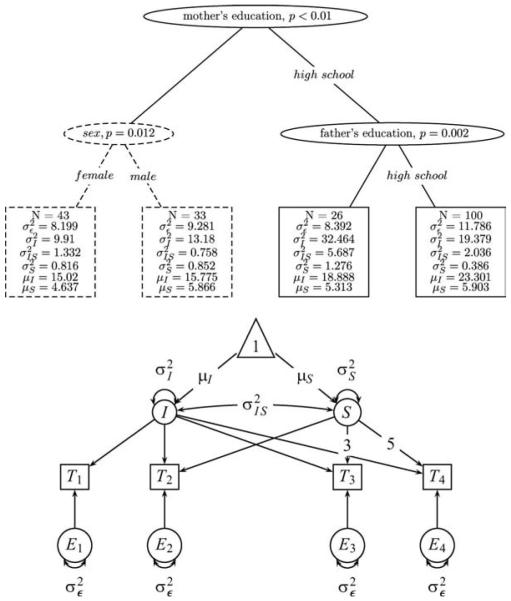
Figure 4.
Upper panel: Structural equation model (SEM) Tree on the longitudinal Wechsler Intelligence Scale for Children data set. A linear latent growth curve model served as the template model. The model indicates that the sample is maximally heterogeneous with respect to mother’s education, which accounts for differences in the learning curves between the two subsamples. The split point of both father’s and mother’s education corresponds to whether they graduated from high school. The dashed line indicates the subtree that was not constructed when cross-validation was used as the construction method. Lower panel: Representation of the linear latent growth model that served as the template model for the SEM Tree above.

