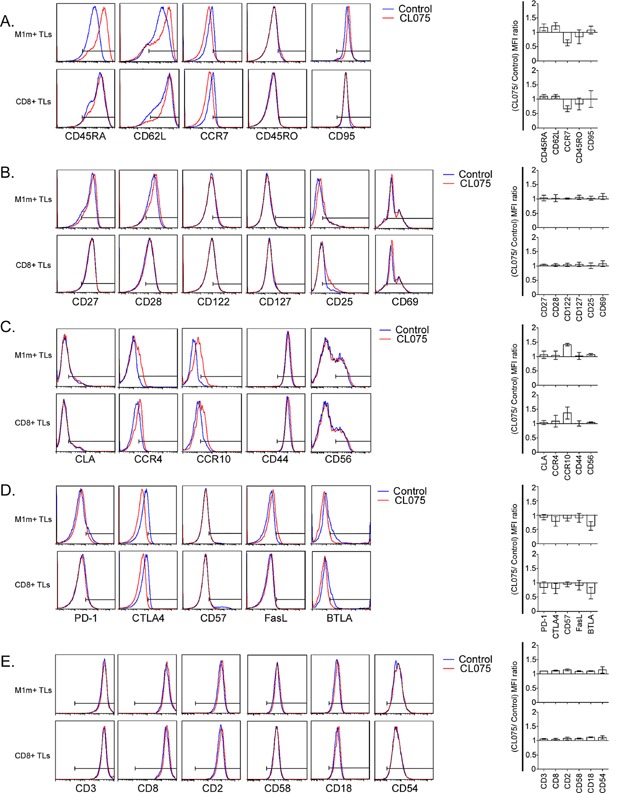
Figure 6.

TLR8 engagement on CTLs slightly increases CD45RA, CD62L and CCR10 expression, and slightly decreases CCR7, CTLA4, and BTLA expression. A,B,C,D,E: Left panels: representative staining examples of total cytotoxic T lymphocytes obtained after one round of stimulation on AAPCs at D21 (CD8+ CTLs, lower panels) and of M1m-specific T lymphocytes purified by magnetic sorting and re-amplified on AAPCs until D35 (M1m+ CTLs, upper panels). TLR8 pathway stimulation was achieved by adding TLR8 synthetic agonist (CL075) 24 h before the end of the co-culture. Bars on histograms were placed according to isotype control staining. Right panels: ratios of mean fluorescence intensities (MFI) of the different markers studied on CD8+ CTLs (lower histograms) and on M1m+ CTLs (upper histograms). Ratios were calculated using the formula: MFI of the corresponding marker in TLR8 pathway-stimulated TLs/MFI of the corresponding marker in the control TLs. These graphs represent the results obtained with six healthy donors, each donor having been studied in three independent co-culture experiments. Cell surface markers are organized as following: A. Differentiation state markers. B. Activation state markers. C. Homing markers. D. Functional inhibition markers. E. Cell interaction and functional avidity markers.
