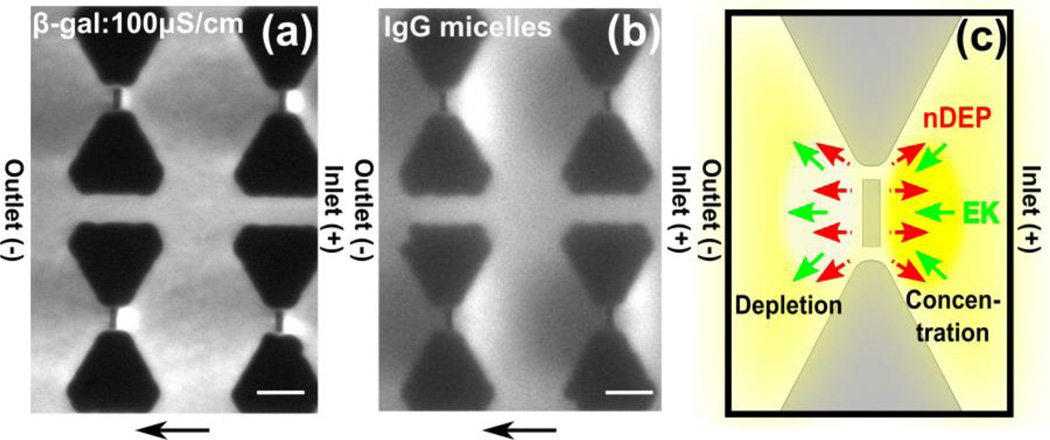
Figure 2.
(a.b) Fluorescence microscopy images obtained experimentally by DC iDEP experiments with β-galactosidase and IgG encapsulated in micelles. Flow direction is from right to left. Scale bar indicates 10 µm. (a) β-galactosidase shows concentration at the inlet side of the nanoposts and depletion at the outlet side due to negative DEP with 100 µS/cm phosphate buffer at 100V applied across a 0.8 cm channel. (b) IgG micelles concentrate at the inlet side of the nanoposts and deplete at the opposite side due to nDEP with 100 µS/cm phosphate buffer at 50 V applied across a 1 cm channel. (c) Schematics showing the flow directions due to DEP and electrokinesis and the resultant species concentration and depletion around the nanoconstriction. Negative DEP counteracts electrokinesis at the inlet side of the nanopost, resulting in protein concentration at the inlet side, whereas depletion occurs at the outlet side (yellow).

