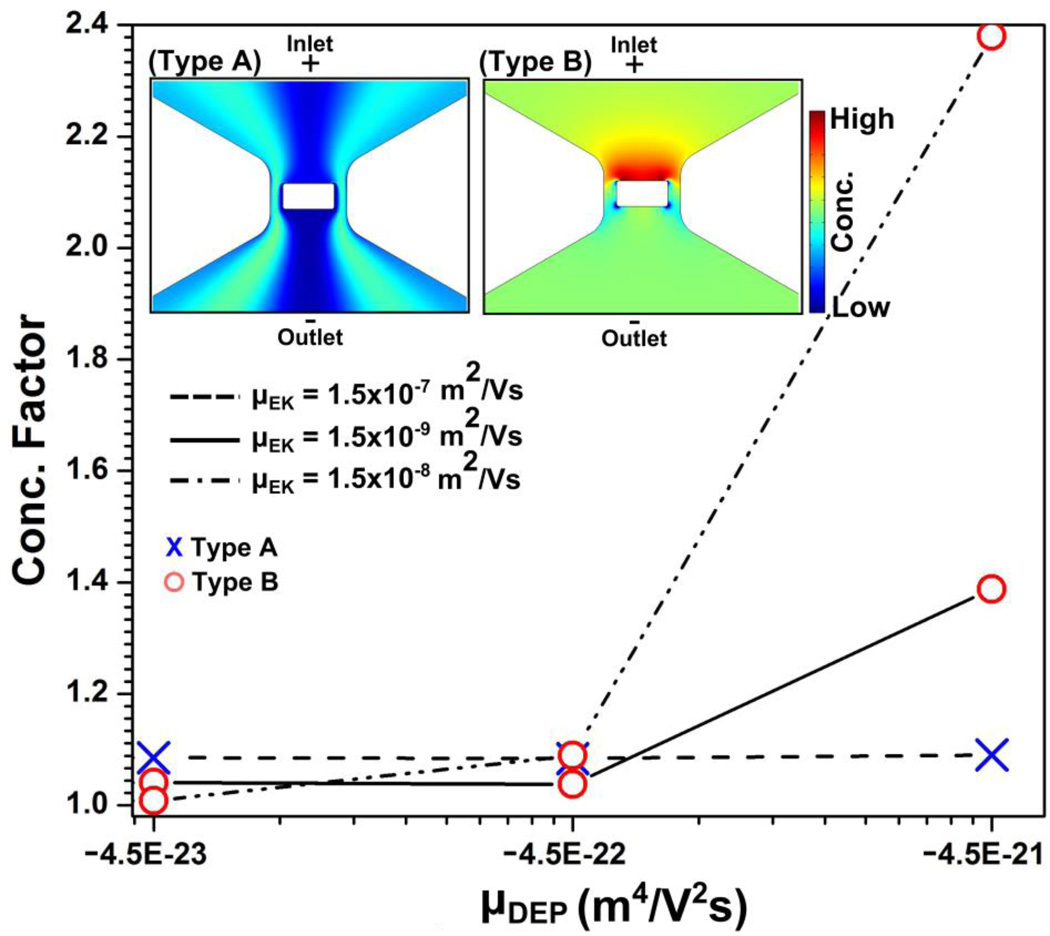
Figure 4.
The resultant concentration factors obtained by numerical simulations are plotted as a function of µDEP for three different µEK mobilities. Different markers are used in order to represent the different types of concentration distributions: red circle markers and blue cross markers representing the type A and B concentration distributions, respectively. The inset shows type A and B concentration distributions as obtained by numerical simulation.

