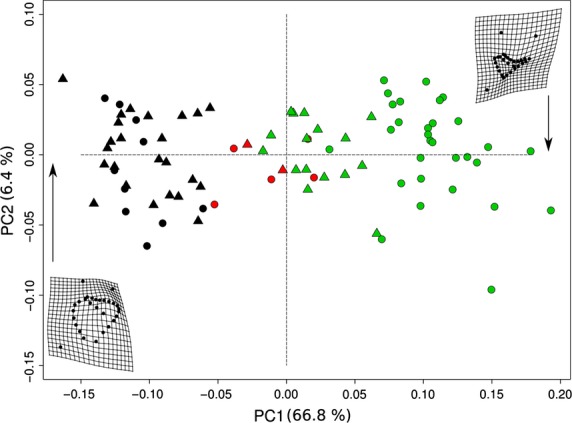
Figure 13.

Principal components analysis of shape variables in tangent space showing shape variation. Deformation grids display the shape of specimens of Mirounga leonina at the ends of the range of variability along PC1. Black, CI. Red, CII. Green, CIII. Circles correspond to males and triangles to females.
