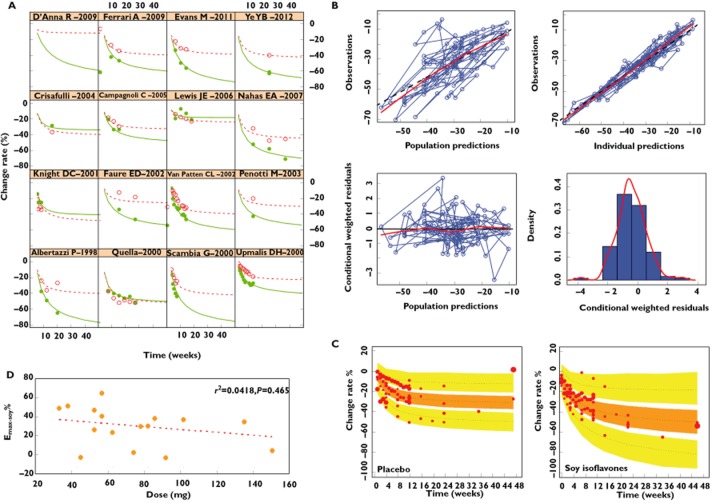
Figure 2.
Model evaluation. (A) Time course of mean % change of hot flashes from baseline for each individual study. (B) Model diagnosis graph. (C) Prediction corrected visual predictive check of the model. The dashed lines are the 5th, 50th and 95th percentiles of observed data. The shaded areas are the corresponding confidence intervals of the simulated data. The solid points represent observed data, and the symbol size is proportional to the number of subjects in each study. (D) The relationship between the dose of soy isoflavones and the predicted Emax-soy value.  , observed value-soy isoflavones;
  , observed value-placebo;
  , predicted value-soy isoflavones;
  , predicted value-placebo

