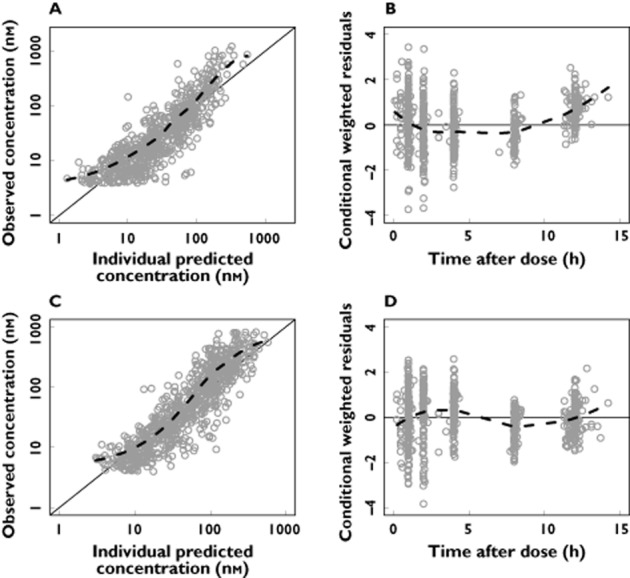
Figure 3.

Basic goodness-of-fit plots for the artemether/dihydroartemisinin model. Observations plotted against individual predicted concentrations of artemether (A) and dihydroartemisinin (C). Conditional weighted residuals of artemether (B) and dihydroartemisinin (D) plotted against time after dose. The solid line is the identity line and the broken line is the locally weighted least square regression line. The concentrations are presented on a logarithmic (base 10) axis
