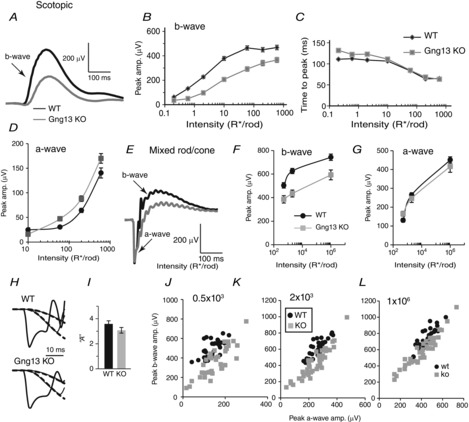
Figure 3.

Absence of Gγ13 reduces scotopic ERG b-waves
Black lines and symbols indicate WT mice and grey lines and symbols indicate KO mice. A to D, scotopic conditions (dark-adapted, rod only stimulation). A, an example of the ERG responses of littermate WT and Gng13 KO mice to 10 R* per rod (flash in the scotopic range). B, average peak amplitude (amp.) (± SEM) of scotopic b-wave vs. flash intensity; responses in KO mice are reduced (depending on intensity; for WT mice, the number of records was 31–40 and, for KO mice, it was 35–48. Note that SEM for several intensities was smaller than the symbol size). C, average time to peak (± SEM) of b-wave for the same data as in B. D, peak a-wave amplitude vs. intensity for WT and KO mice; the difference in amplitude between WT and KO mice for most responses was highly significant. E to L, Mixed rod/cone input (dark-adapted, bright light stimulates both rods and cones). Data are from 24 records from 13 WT mice and 21 records from 16 KO mice. E, representative examples of ERG responses of WT and KO littermates to saturated bright light under dark-adapted conditions representing mixed rod and cone responses. F, peak b-wave amplitude vs. 3 rod-saturating intensities for WT and KO mice. The difference in amplitude between responses for WT and KO mice was highly significant. G, peak a-wave amplitude vs. 3 rod-saturating intensities for WT and KO mice; no significant difference was found. H and I, Lamb and Pugh analysis of the amplification factor ‘A’. H, examples of expanded normalized a-wave responses and their fits (dashed lines) for WT and KO mice. I, the resulting average ‘A’ values for WT and KO mice. J to L, correlograms of a- and b-waves for the three strong stimuli (indicated on the graphs in R*/rod). Each dot represents data from one ERG recording. Note that, for any a-wave amplitude, the corresponding b-wave amplitude in WT mice is greater than that in KO mice.
