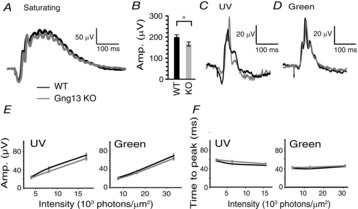
Figure 4.

Absence of Gγ13 hardly affects the photopic ERG
A, C and D, examples of ERG responses under light-adapted conditions representing purely cone-generated responses. A, responses to bright (saturating) photopic stimulation (1000 scot cd s m−2). B, average amplitude (Amp.) of b-wave (± SEM) in response to the saturated flash (26 records from 14 WT mice and 35 records from 18 KO mice). C, responses to a UV flash (0.0035 cd s m−2 or 3.6 × 10³ photons μm–2). D, responses to a green light (4 cd s m−2 or 7.2 × 10³ photons μm–2). E, average amplitude of b-wave (± SEM) vs. flash intensity for UV and green lights. F, time to peak of b-wave using same records as in E. Average responses (Amp.) under photopic conditions were similar for WT and KO mice.
