
Figure 1.
Rod light responses in the intact mouse retina
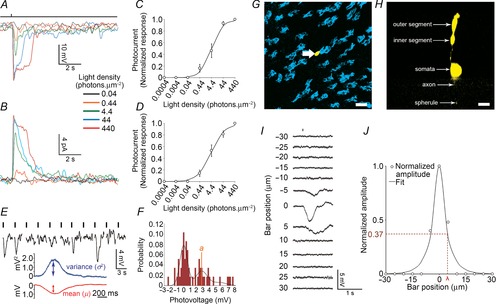
Rod light responses were recorded in the intact mouse retina during the morning (ZT00–06) under dark-adapted conditions (>1 h). A and B, representative examples of light-evoked rod membrane voltage (A) and current (B) responses to a series of 20 ms full-field 500 nm light flashes of increasing density ranging from 0.044 to 440 photons μm−2 obtained at ZT02. Flash monitor is shown on top of the traces. Bandwith DC to 50 Hz. RMP was –29.0 mV in A and –31.2 mV in E. Holding current was 7.5 pA in B. C and D, average normalized intensity–response curves of rods recorded under the conditions depicted in A and B. Error bars, SEM, n = 33 (C) and 4 (D) (1 cell retina−1). E and F, response variability to dim flashes and electrical coupling of the rods. Representative examples of rod responses to a series of repetitive 20 ms full-field 500 nm dim light flashes, illustrating amplitude fluctuations of a rod to dim light flashes (E) and the probability density calculated from 150 consecutive recordings from the same cell (F), some of which are illustrated in E. Vertical black bars indicate the timing of flashes in E. G and H, representative example of a Neurobiotin-filled single rod. Shown are a tangential section (optical sections 5 × 1 μm) at the level of the inner segment of the injected rod (G) and a perpendicular view of the 3D projection of a 70 μm thick Z-stack of the outer nuclear layer that includes the same cell (H). Cone inner segments are labelled with Dylight647-conjugated peanut agglutinin (PNA, blue; G). The different morphological parts of the injected rod are labelled (H). Note that, following iontophoresis of Neurobiotin into individual rods, the tracer (yellow) remained in the injected cell. Scale bars: 5 μm. I and J, measurement of the rod receptive field size. The receptive field size of single rods was measured by presenting a 5-μm thick slit of dim 500 nm light of fixed intensity for 50 ms and moving it by 5 μm every 3 s across the retinal surface using the Lucivid system. Representative examples of rod responses to the slit of light presented at different distances from the centre of the recorded cell are illustrated (I). Normalized response amplitudes plotted against distance of the slit from the centre of the recorded cell and fitted to an exponential equation are also illustrated (eqn 16; J). The length constant (λ) was used as a measure of the receptive field size.