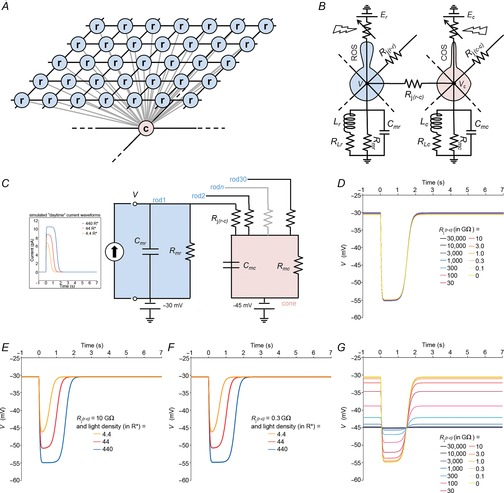
Figure 12.

Resistive–capacitive model of the mouse photoreceptor network
A, idealized arrangement of the rods and cones in the mouse retina. Each rod (blue circles) is electrically coupled to its 4 closest neighbours and to 1 cone (pink circle). Each cone is coupled to most of the rods in its vicinity and to other cones as well. See Methods for details. B, an electrical equivalent resistive–capacitive–inductive circuit model of the photoreceptor network of the mouse. Cmc, cone membrane capacitance; Cmr, rod membrane capacitance; COS, cone outer segment; Ec, reversal potential of the cone light sensitive conductance; Er, reversal potential of the rod light sensitive conductance; Lc, cone inductance; Lr, rod inductance; RLc, cone shunt resistance; RLr, rod shunt resistance; Rj(c–c), cone–cone junction resistance; Rj(r–c), rod–cone junction resistance; Rj(r–r), rod–rod junction resistance; Rmc, cone membrane resistance; Rmr, rod membrane resistance; ROS, rod outer segment; V, rod membrane potential; Vc, cone membrane potential. C, a simplified equivalent resistive–capacitive circuit model of the mouse photoreceptor network we used for simulation of the rod membrane potential as a function of current and time. The cone compartment is connected to 30 rods. The RMP of the rod is set at –30 mV and that of the cone at –45 mV. Insert shows the simulated daytime current waveforms injected simultaneously in each of the rod compartments to simulate changes in the dark current caused by the phototransduction processes for a flash intensity of 4.4R*, 44R* or 440R*. Current peak is 7, 8.8 and 10.5 pA for flash intensities of 4.4R*, 44R* or 440R*, respectively. D, simulation of the rod membrane potential (c) as a function of time for different values of the rod–cone gap junction resistance (Rj(r–c)) ranging from 0 to 30,000 GΩ (≈ no coupling). Simulated daytime current for a flash of 440R*, Rmc = Rmr = 2.4 GΩ and Cmr = Cmc = 10 pF. Note that a change in Rj(r–c) does not significantly affect the rod RMP or the amplitude or kinetics of the response. Thus, the rod RMP and light response remain essentially unaffected by strength of rod–cone coupling. E and F, simulation of the rod membrane potential (V) as a function of time for different values of light density using daytime current functions when rods and cones are weakly coupled (Rj(r–c) = 10 GΩ at all 30 rod–cone gap junctions; E) or strongly coupled (Rj(r–c) = 0.3 GΩ at all 30 rod–cone gap junctions; F). The model predicts that when rods and cones are either weakly coupled (E) or strongly coupled (F), the simulated traces essentially mirror the current traces and resemble those recorded during the daytime and depicted in Figs1A and 3A. Rmc = Rmr = 2.4 GΩ and Cmr = Cmc = 10 pF. (G) Simulation of the cone membrane potential (Vc) as a function of time for different values of the rod–cone gap junction resistance (Rj(r–c)) ranging from 0 to 30,000 GΩ (≈ no coupling). Simulated daytime current waveforms for a flash of 440R* were injected simultaneously in each of the rod compartments, Rmc = Rmr = 2.4 GΩ and Cmr = Cmc = 10 pF. The cone photocurrent was ignored in the model (see Methods for details). Note the strong influence of the coupled rods on the cone polarization for Rj(r–c) ≤ 30 GΩ. Overall, the model predicts that the rod polarization and the speed and amplitude of the rod voltage response should remain essentially unaffected by the state of rod–cone coupling.
