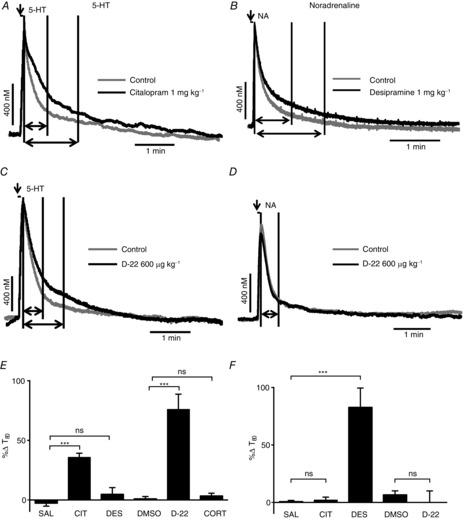
Figure 7.

Effect of uptake inhibitors on exogenously applied 5-HT (left column) or noradrenaline (NA; right column) into the NTS
Voltammetric oxidation currents produced in response to local pressure ejection of 5-HT (A and C; 0.1 mm) and NA (B and D; 1 mm) into the NTS. Predrug/vehicle controls (light grey) are overlaid in black with citalopram (1 mg kg−1, i.v.; A), desipramine (1 mg kg−1; B) and D-22 (600 μg kg−1; C and D). The first vertical line on the traces indicates time 0, the second shows T80 for the control and the third T80 for the drug, although in D only a second line is shown because the T80 for control and D-22 where identical. The horizontal arrows show the distance between time 0 and T80 on the traces, while the vertical arrow shows when 5-HT or NA is microinjected. E and F show bar graphs of mean percentage changes in the time taken for the electrochemical signal for 5-HT and noradrenaline to decay to 80% of its peak value (T80) in the presence of saline (SAL; n = 8/6) citalopram (CIT; n = 4/5), desipramine (n = 4/5), DMSO (0.1 ml kg−1; n = 7/4), D-22 (n = 5/5), corticosterone (CORT; 1 mg kg−1; n = 5) from pre-drug/vehicle. The n numbers given for each substance apply for both bar graphs E and F. The error bars show the SEM. These changes were compared with vehicle control using a one-way ANOVA and the means compared with Fisher's LSD test. ***P < 0.001.
