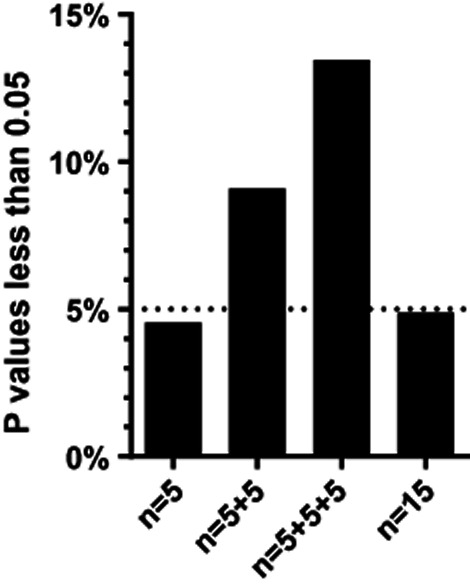
Figure 2.

The problem of ad hoc sample size selectionI simulated 10,000 experiments sampling data from a Gaussian distribution with means of 5.0 and standard deviations of 1.0, and comparing two samples with n = 5 each using an unpaired t test. The first column shows the percentage of those experiments with a P value less than 0.05. Since both populations have the same mean, the null hypothesis is true and so (as expected) about 5.0% of the simulations have P values less than 0.05. For the experiments where the P value was higher than 0.05, I added five more values to each group. The middle column (‘n = 5 + 5’) shows the fraction of P values where the P value was less than 0.05 either in the first analysis with n = 5 or after increasing the sample size to 10. For the third column, I added yet another 5 values to each group if the P value was greater than 0.05 for both of the first two analyses. Now 13% of the experiments (not 5%) have reached a P value less than 0.05. For the fourth column, I looked at all 10,000 of the simulated experiments with n = 15. As expected, very close to 5% of those experiments had P values less than 0.05. The higher fraction of ‘significant’ findings in the n = 5 + 5 and n = 5 + 5 + 5 is due to the fact that I increased sample size only when the P value was high with smaller sample sizes. In many cases, when the P value was less than 0.05 with n = 5 the P value would have been higher than 0.05 with n = 10 or 15, but an experimenter seeing the small P value with the small sample size would not have increased sample size.
