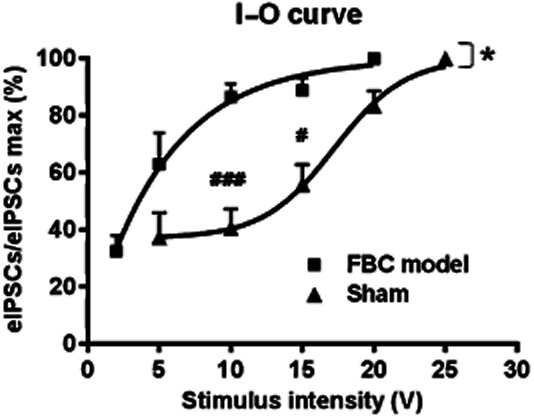
Figure 2.

The input-output (I–O) relationship curve of GABAergic eIPSCs in VLPAG neurons was shifted to the left in slices from the FBC model. The asterisk indicates a statistically significant difference in the I–O relationship curve between the FBC model and sham-operated mice, as determined by two-way anova [F(1,32) = 9.098, *P < 0.05]. The sharp indicates a statistically significant difference in the relative amplitude of eIPSCs to maximal (max) eIPSCs at each stimulus intensity between the FBC model and sham-operated mice groups, as determined by a Bonferroni multiple-comparison post hoc test (###P < 0.001 at 10 V, #P < 0.05 at 15 V). Each point represents means ± SEM (n = 6).
