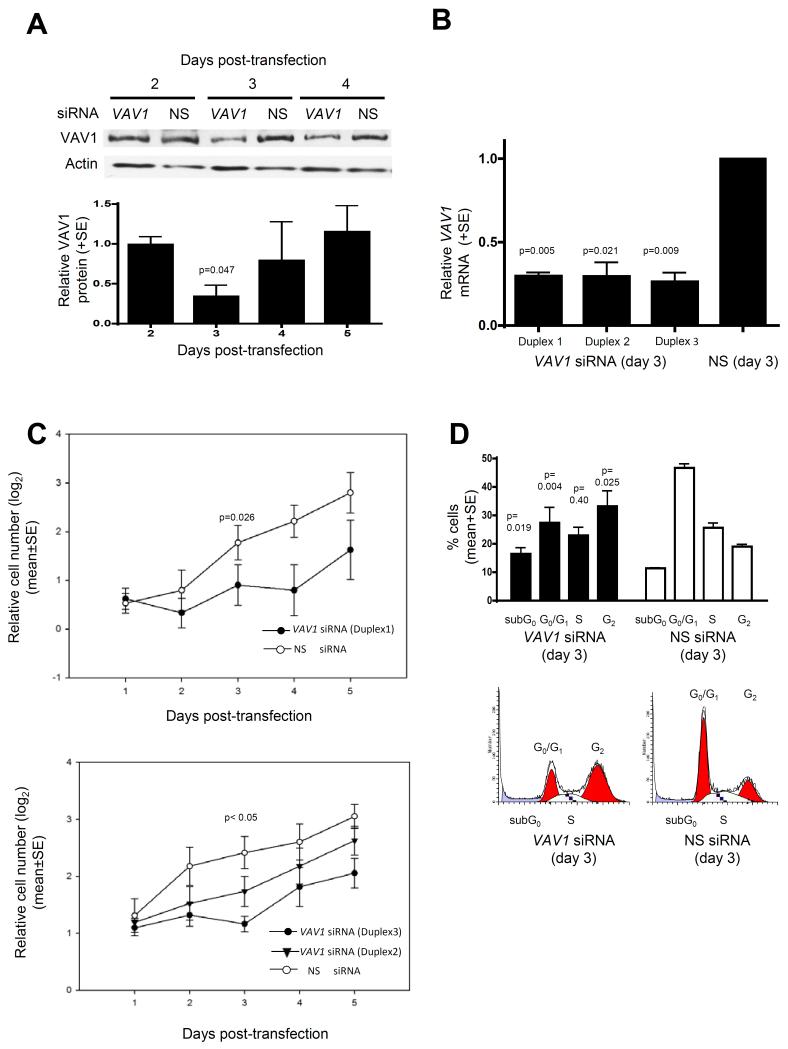
Figure 4. VAV1 expression promotes proliferation in VAV1 hypo-methylated human medulloblastoma cells.
A,B. Consistent reduction of VAV1 expression (60-70%) in VAV1 hypo-methylated DAOY medulloblastoma cells (Figure 3) at 3 days post-transfection with 3 anti-VAV1 siRNA duplexes, compared to non-silencing (NS) siRNA. A. Western blot shows representative VAV1 knockdown and graph shows the mean reduction in VAV1 expression (+SE; based on three independent replicates) caused by anti-VAV1 siRNA (duplex 1) relative to NS siRNA controls, following normalization to actin protein levels. B. RT-PCR analysis of VAV1 mRNA expression at 3 days post-transfection with anti-VAV1 siRNA (duplexes 1-3). Graph shows mean reduction in VAV1 expression (+SE; based on four independent replicates) caused by VAV1 siRNA relative to NS siRNA controls, following normalization to the expression of a control gene (TBP). C. Cell proliferation following transfection with anti-VAV1 siRNA or NS siRNA, determined by XTT assay. Graphs show log2 number of cells at 1 to 5 days post-transfection relative to day 0 (before addition of siRNA). Results shown represent 4 independent replicates (+ SE). D. Fluorescence-activated cell sorting (FACS) analysis of cell cycle distribution at 3 days post-transfection (duplex 1). Graph shows mean (+SE) percentage of cells in each cell cycle phase, based on 4 independent replicates. Representative cell cycle distribution plots are shown for each siRNA. All ‘p’ values shown represent paired t-tests.

