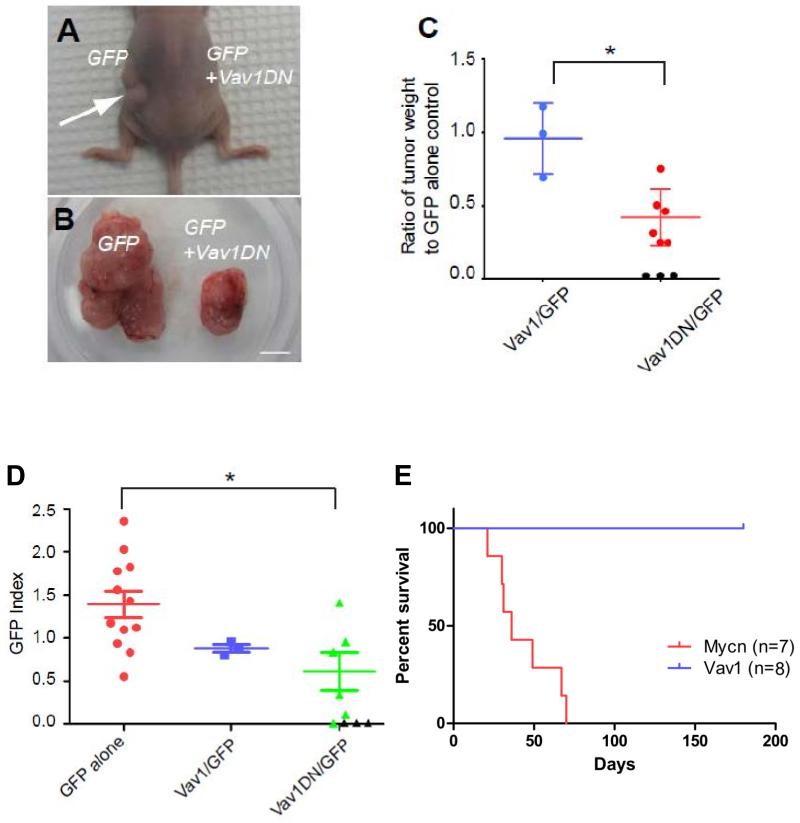
Figure 5. Inhibition of SHH tumor maintenance by a dominant-negative form of Vav1.
A-D. In each experiment Ptch1+/− Cdkn2c−/−mouse medulloblastoma cells infected with a GFP only virus were transplanted into the left side of recipient nude mice, whereas tumor cells infected with Vav1 or Vav1DN viruses were transplanted on the right side. Parallel FACS analysis revealed that approximately 20-40% tumor cells were infected. A. A representative mouse transplanted with tumor cells infected with GFP- (left) or Vav1DN/GFP- (right) carrying retroviruses. A significantly larger tumor appeared on the left side from GFP alone-infected cells (white arrow). B. Surgically removed tumors from a mouse in which tumors developed on both sides. Scale bar, 5mm. C. Quantification of the weight ratio between Vav1- or Vav1DN-expressing tumors compared to control GFP alone-expressing tumors. *p<0.05. Black circles represent transplanted mice that did not develop tumors. D. Contribution of either Vav1-or Vav1DN-expressing cells to tumor maintenance. The GFP index is defined as the ratio of the percentage of GFP-positive tumor cells in the secondary tumors compared to the percentage of GFP-positive infected tumor cells before transplant. Note that 3 recipient mice did not develop secondary tumors from Vav1DN-infected tumor cells (black triangles). *p<0.05. E. Kaplan-Meier survival curve of mice following stereotactic cortical transplantation of GNPs, infected with Vav1/GFP (n=8) or Mycn /GFP GNPs (n=7) retroviruses.

