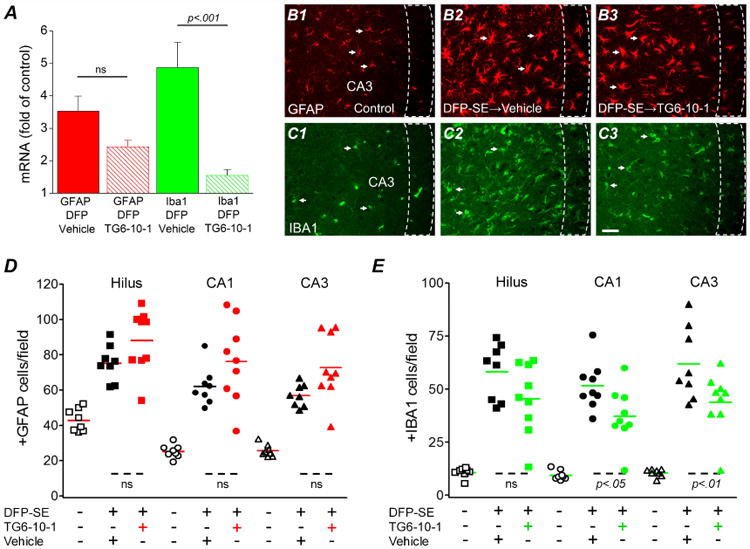
Figure 6. DFP induced microgliosis is reduced by TG6-10-1.

A, induction of GFAP and Iba1 mRNA in the forebrain four days following DFP status epilepticus in vehicle treated (n = 7 rats) and TG6-10-1 treated rats (n = 7 rats) (one-way ANOVA with posthoc Bonferroni). Representative fluorescence images (200× total magnification) showing positive GFAP immunostaining (red) (B1) as an astrocyte marker and Iba1 immunostaining (green) (C1) as a microglial marker in the hippocampal CA3 region. Four days after DFP-induced status epilepticus, astrogliosis and microgliosis were obvious in the sections obtained from rats as defined by the increased number of positively labeled cells in rats treated with 6 injections of TG6-10-1 (B3, C3) compared to sections taken from rats injected with 6 doses of vehicle (B2, C2). The arrows indicate typical astrocytes and microglia in each group. Scale bar, 20 μm. The dash boxes outline the CA3 pyramidal cell layer. Quantification of astrogliosis (D) and microgliosis (E) defined by the number of positive GFAP and Iba1 cells counted in three hippocampal areas (i.e. hilus, CA1 and CA3). The average number of astrocytes and microglia from rats that endured DFP-induced status epilepticus followed by vehicle treatment (6 injections) (n = 8 rats) or TG6-10-1 (n = 9 rats) treatment (6 injections) was compared by one-way ANOVA with posthoc Bonferroni. Each symbol represents data from an individual rat. The short horizontal bold lines (colored) represent the average of the individual animals within the group. The short horizontal dashed lines at the bottom show the groups that are compared.
