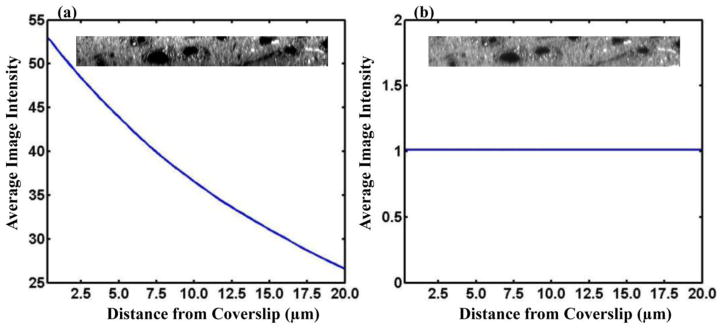
Figure 4.

(a) Plot of average image intensity in the 3D montage as a function of distance from the coverslip. (b) Plot of average image intensity in 3D montage following intensity correction. Insets show yz slices before (a) and after (b) intensity bias correction.
