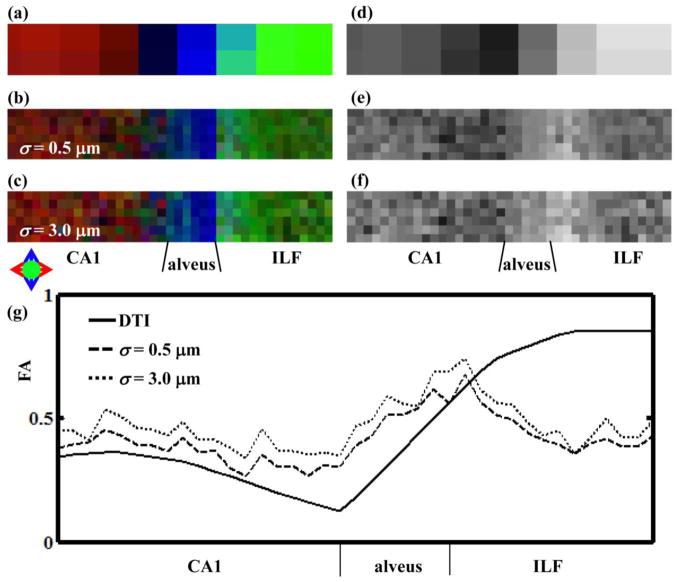
Figure 7.
(a–c) Directional FA maps and (d–f) grayscale FA maps following DTI and 3D structure tensor analyses. (a) and (d) are d-MRI data, (b) and (e) are FAST with σ = 0.5 μm and (c) and (f) are FAST with σ = 3.0 μm. (g) FA (solid thick line) and FAST (dashed and dotted thin lines) values were averaged along the vertical (y) direction and plotted vs. position along the horizontal (x) direction.

